Fig. 10.
Download original image
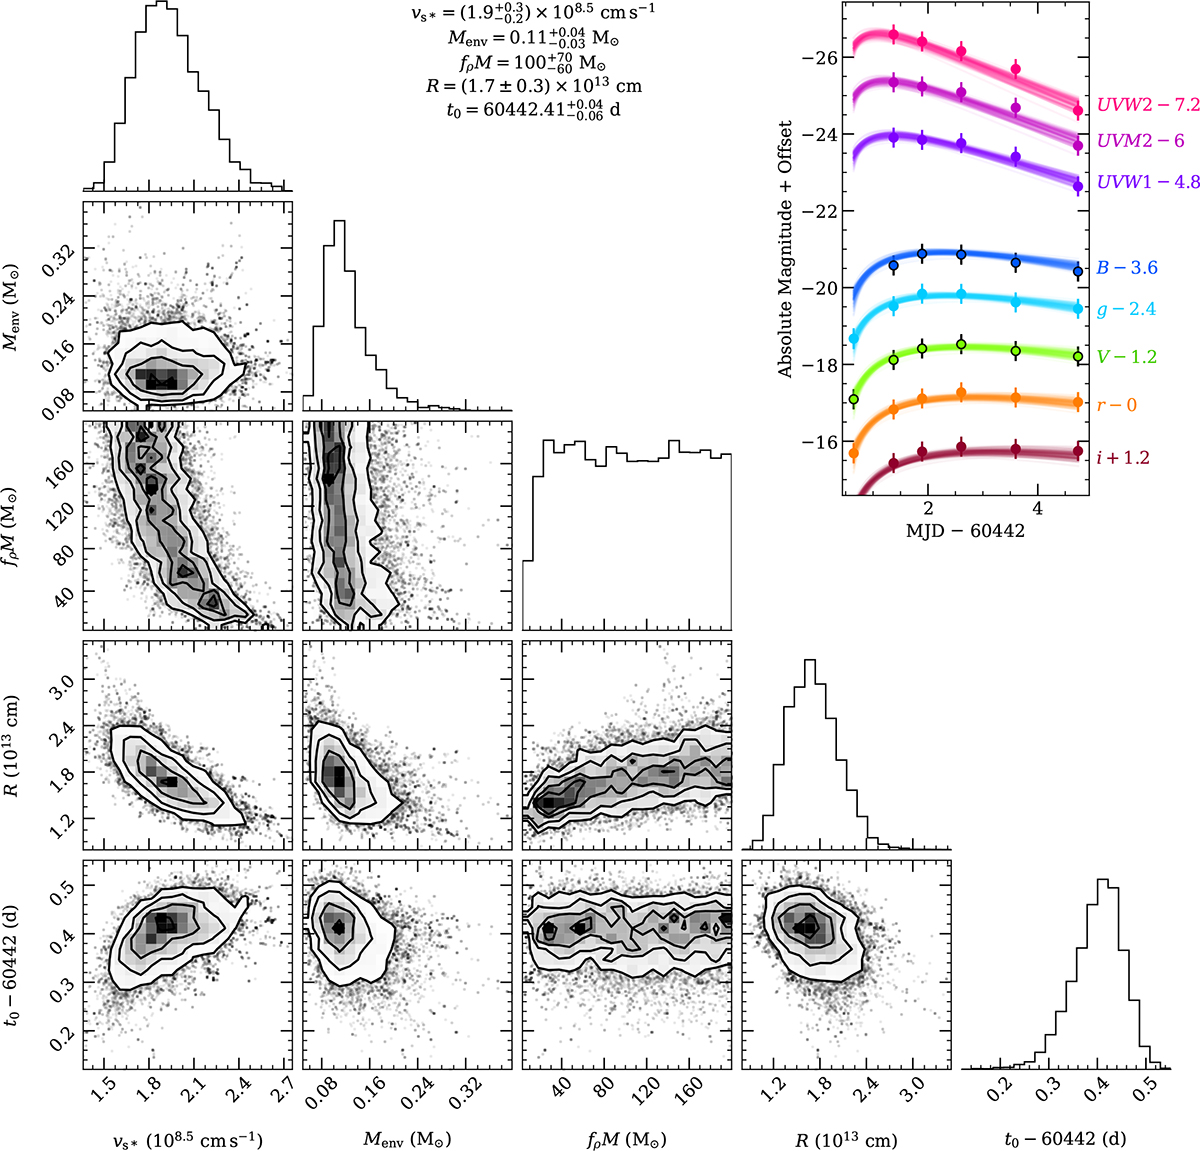
Corner plot presenting the posterior distributions of the SW17 shock-cooling light-curve model of SN 2024iss. The fit to the early light curves was restricted to five days after the estimated time of the SN explosion. The best-fit parameters are listed at the top of the figure. The upper-right inset presents the model light curves that best fit the multiband photometry, as displayed by color coded curves and symbols, respectively.
Current usage metrics show cumulative count of Article Views (full-text article views including HTML views, PDF and ePub downloads, according to the available data) and Abstracts Views on Vision4Press platform.
Data correspond to usage on the plateform after 2015. The current usage metrics is available 48-96 hours after online publication and is updated daily on week days.
Initial download of the metrics may take a while.