Fig. 13.
Download original image
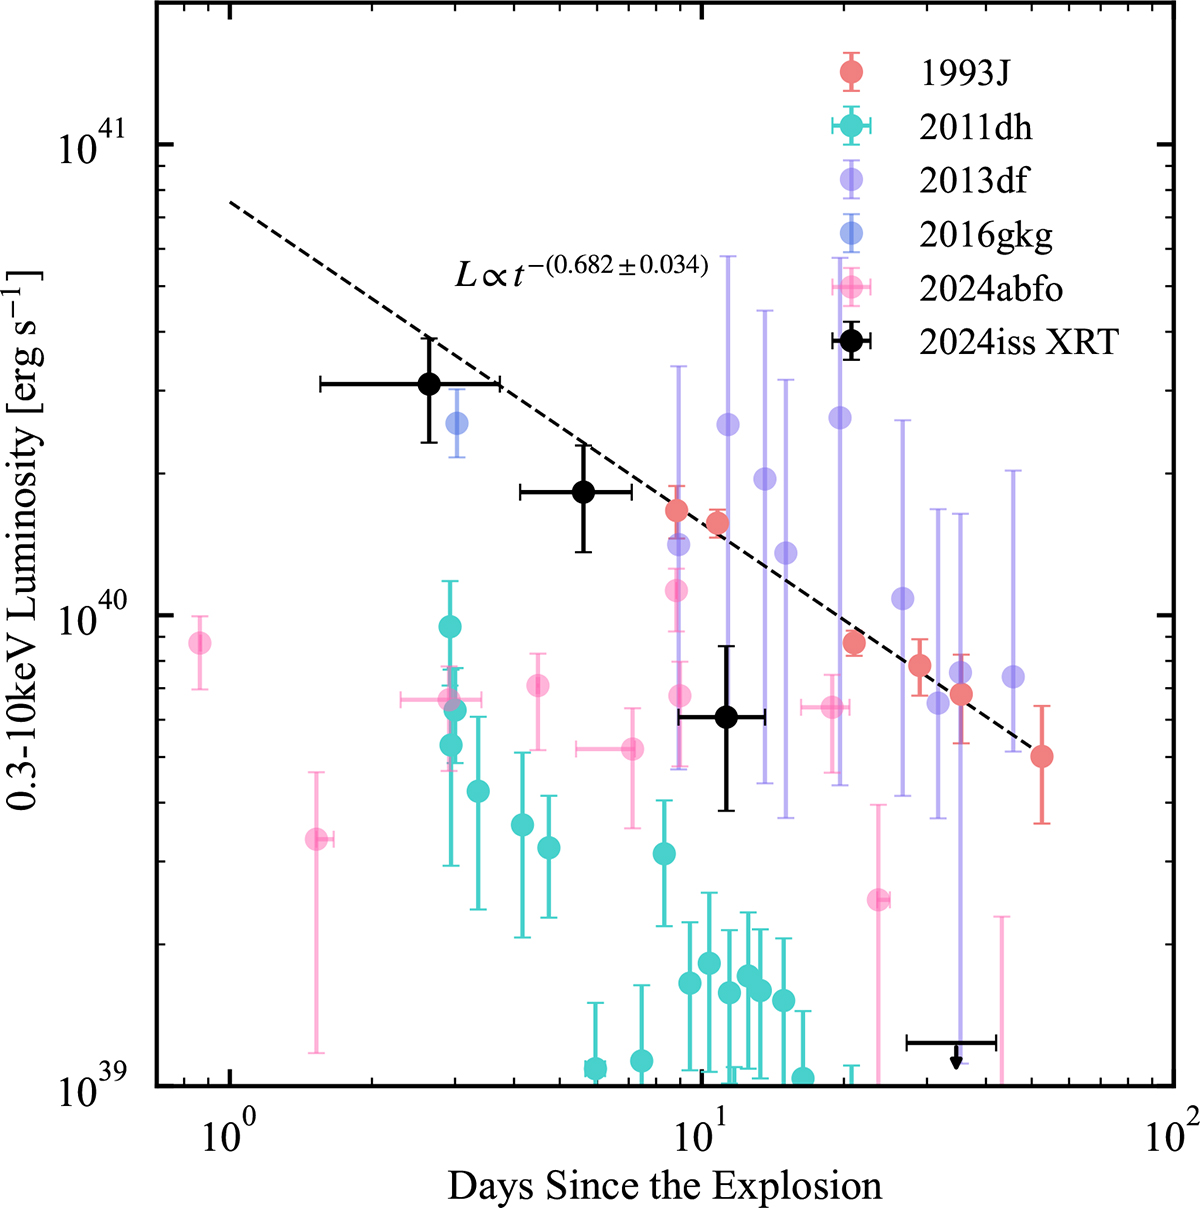
X-ray luminosity evolution at 0.3–10 keV of SN 2024iss compared with that of SNe 1993J (Chandra et al. 2009), 2011dh (Soderberg et al. 2012), 2013df (Kamble et al. 2016), 2016gkg (Dwarkadas 2025), and 2024abfo (Reguitti et al. 2025). While most of the comparison data are in the 0.3–10 keV band, the fluxes of SNe 1993J and 2013df were measured in the 0.3–8 keV band.
Current usage metrics show cumulative count of Article Views (full-text article views including HTML views, PDF and ePub downloads, according to the available data) and Abstracts Views on Vision4Press platform.
Data correspond to usage on the plateform after 2015. The current usage metrics is available 48-96 hours after online publication and is updated daily on week days.
Initial download of the metrics may take a while.