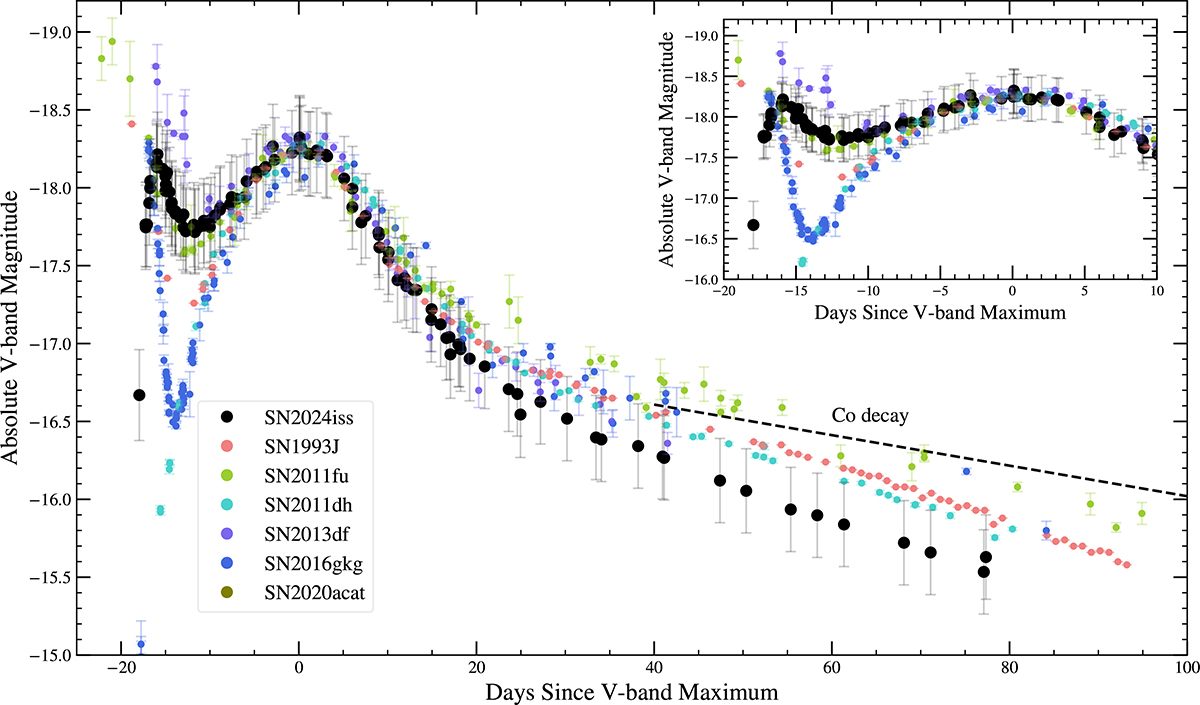
Fig. 2.
Download original image
Light curve in the V band for SN 2024iss compared to those of well-sampled cases: Type IIb SNe 1993J, 2011dh, 2013df, 2016gkg, and 2020acat. The light curves of the comparison SNe have been shifted in both magnitude and time to align with the peak magnitude and the time of the V light-curve peak of SN 2024iss. The dashed black line represents the expected decline rate of [56]Co (0.98 mag (100 day)−1; Woosley et al. 1989). The upper-right inset shows a zoom-in of the first 30 days.
Current usage metrics show cumulative count of Article Views (full-text article views including HTML views, PDF and ePub downloads, according to the available data) and Abstracts Views on Vision4Press platform.
Data correspond to usage on the plateform after 2015. The current usage metrics is available 48-96 hours after online publication and is updated daily on week days.
Initial download of the metrics may take a while.