Open Access
Fig. 5.
Download original image
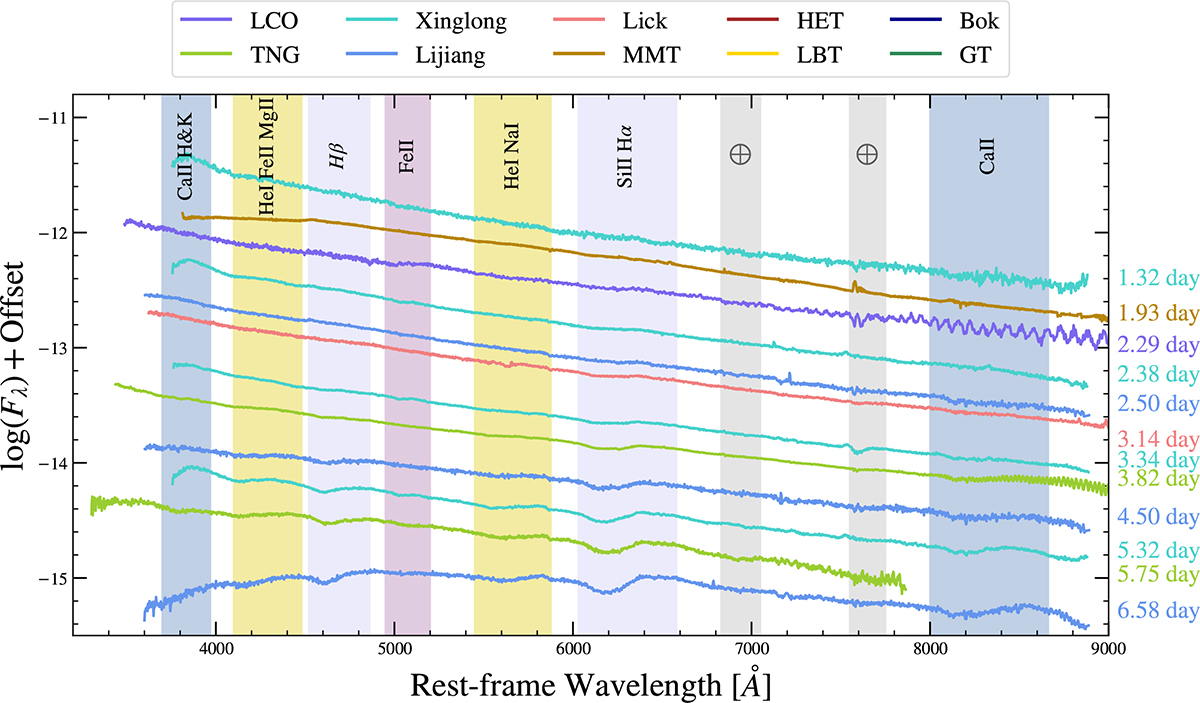
Spectral sequence of SN 2024iss, spanning the first 7 days after the explosion. Phases are marked on the right. Different colors distinguish the different spectrographs used in the observations, as shown at the top. A log of the spectroscopy of SN 2024iss is given in Table A.3.
Current usage metrics show cumulative count of Article Views (full-text article views including HTML views, PDF and ePub downloads, according to the available data) and Abstracts Views on Vision4Press platform.
Data correspond to usage on the plateform after 2015. The current usage metrics is available 48-96 hours after online publication and is updated daily on week days.
Initial download of the metrics may take a while.