Open Access
Fig. 2
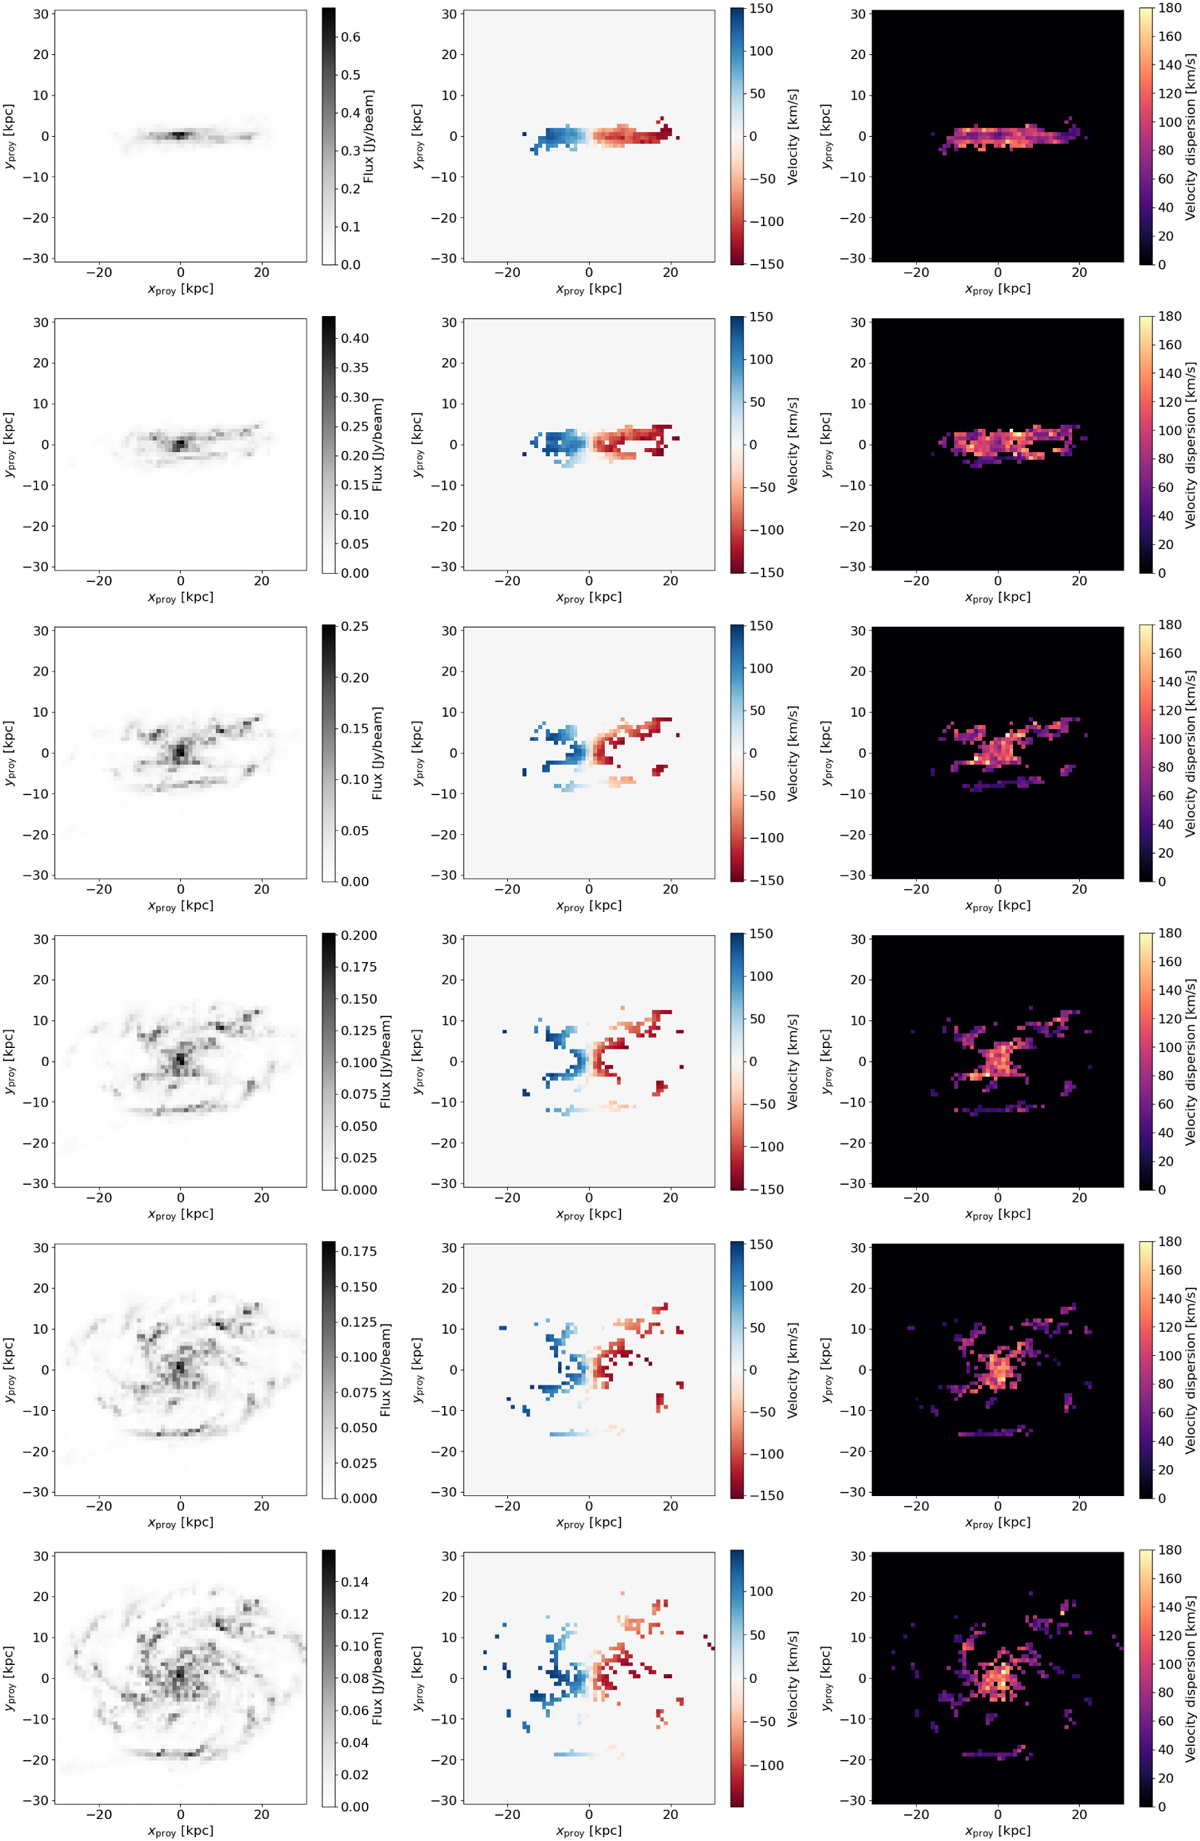
Download original image
Gas information input maps for a single galaxy from the NIHAO sample of M* = 1010.68 M⊙ at increasing inclinations from edge-on to 60 degrees. From left to right: HI intensity, average line-of-sight velocity, and velocity dispersion maps, obtained following the procedure described in Sect. 3.1.2.
Current usage metrics show cumulative count of Article Views (full-text article views including HTML views, PDF and ePub downloads, according to the available data) and Abstracts Views on Vision4Press platform.
Data correspond to usage on the plateform after 2015. The current usage metrics is available 48-96 hours after online publication and is updated daily on week days.
Initial download of the metrics may take a while.