Fig. 5
Download original image
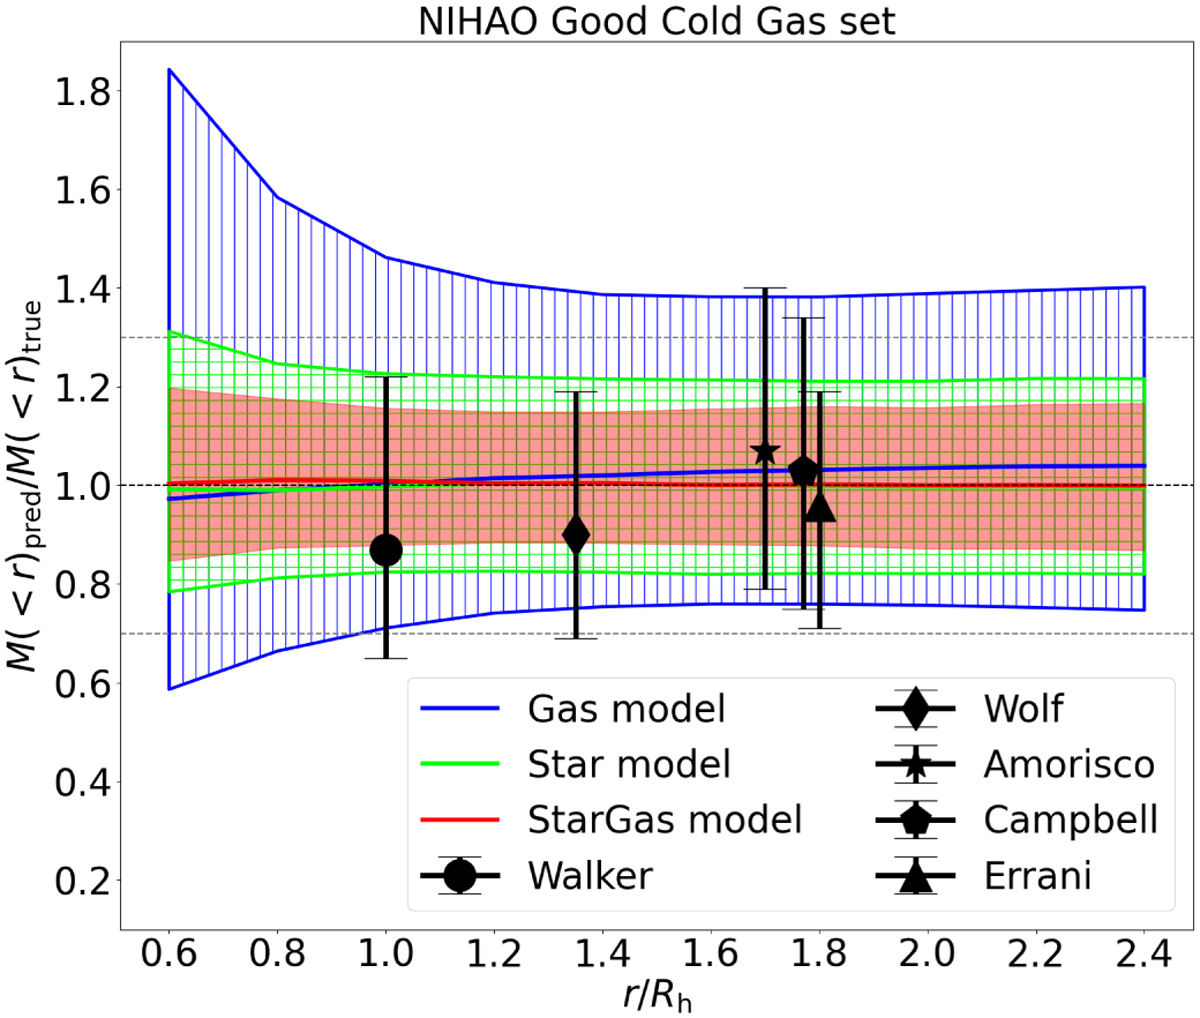
Ratio of the mass predicted by the neural network models to the real mass enclosed within different radii of the galaxies in the test sets of NIHAO galaxy projections. The coloured lines show the median ratio using the mass estimated by the CNN for the training set, while the shaded regions indicate the 1σ errorbars. Blue: Results when using the three gas channels described in Sect. 3.2, the radius where the cold gas superficial density falls below 1 M⊙ pc−2, and the mean velocity dispersion inside that radius. Green: Results when using the two star channels described in Sect. 3.2, the projected half-light radius, and the mean velocity dispersion of the stars. Red: Results when using all of the above. The predicted-to-true enclosed mass ratios resulting from applying the literature mass estimators to NIHAO galaxies are shown as black symbols with 1σ errorbars.
Current usage metrics show cumulative count of Article Views (full-text article views including HTML views, PDF and ePub downloads, according to the available data) and Abstracts Views on Vision4Press platform.
Data correspond to usage on the plateform after 2015. The current usage metrics is available 48-96 hours after online publication and is updated daily on week days.
Initial download of the metrics may take a while.