Open Access
Fig. 10.
Download original image
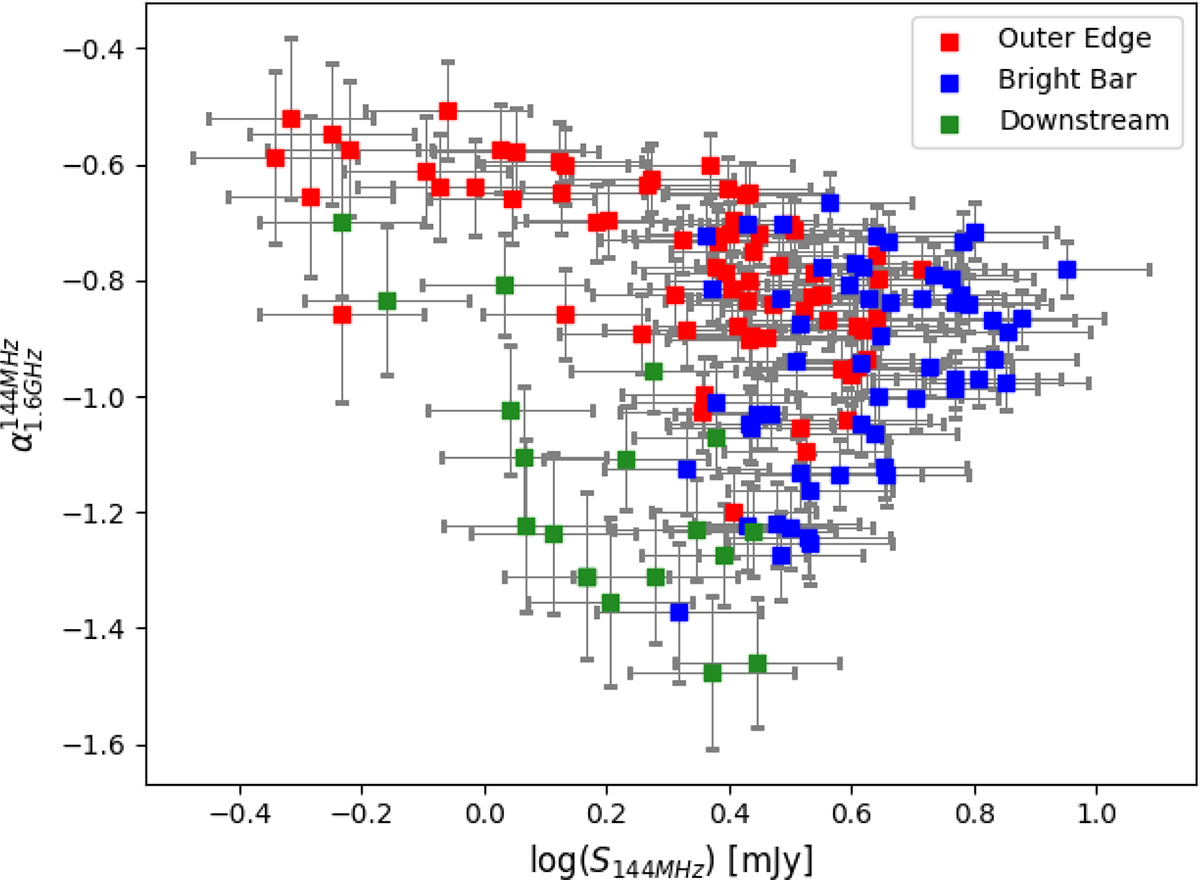
Spectral index versus LOFAR 144 MHz flux density. The spectral index is calculated between LOFAR 144 MHz and JVLA 1.6 GHz data to leverage the broadest available frequency range. The high resolution of the images allows identification of the two substructures of the NE relic.
Current usage metrics show cumulative count of Article Views (full-text article views including HTML views, PDF and ePub downloads, according to the available data) and Abstracts Views on Vision4Press platform.
Data correspond to usage on the plateform after 2015. The current usage metrics is available 48-96 hours after online publication and is updated daily on week days.
Initial download of the metrics may take a while.