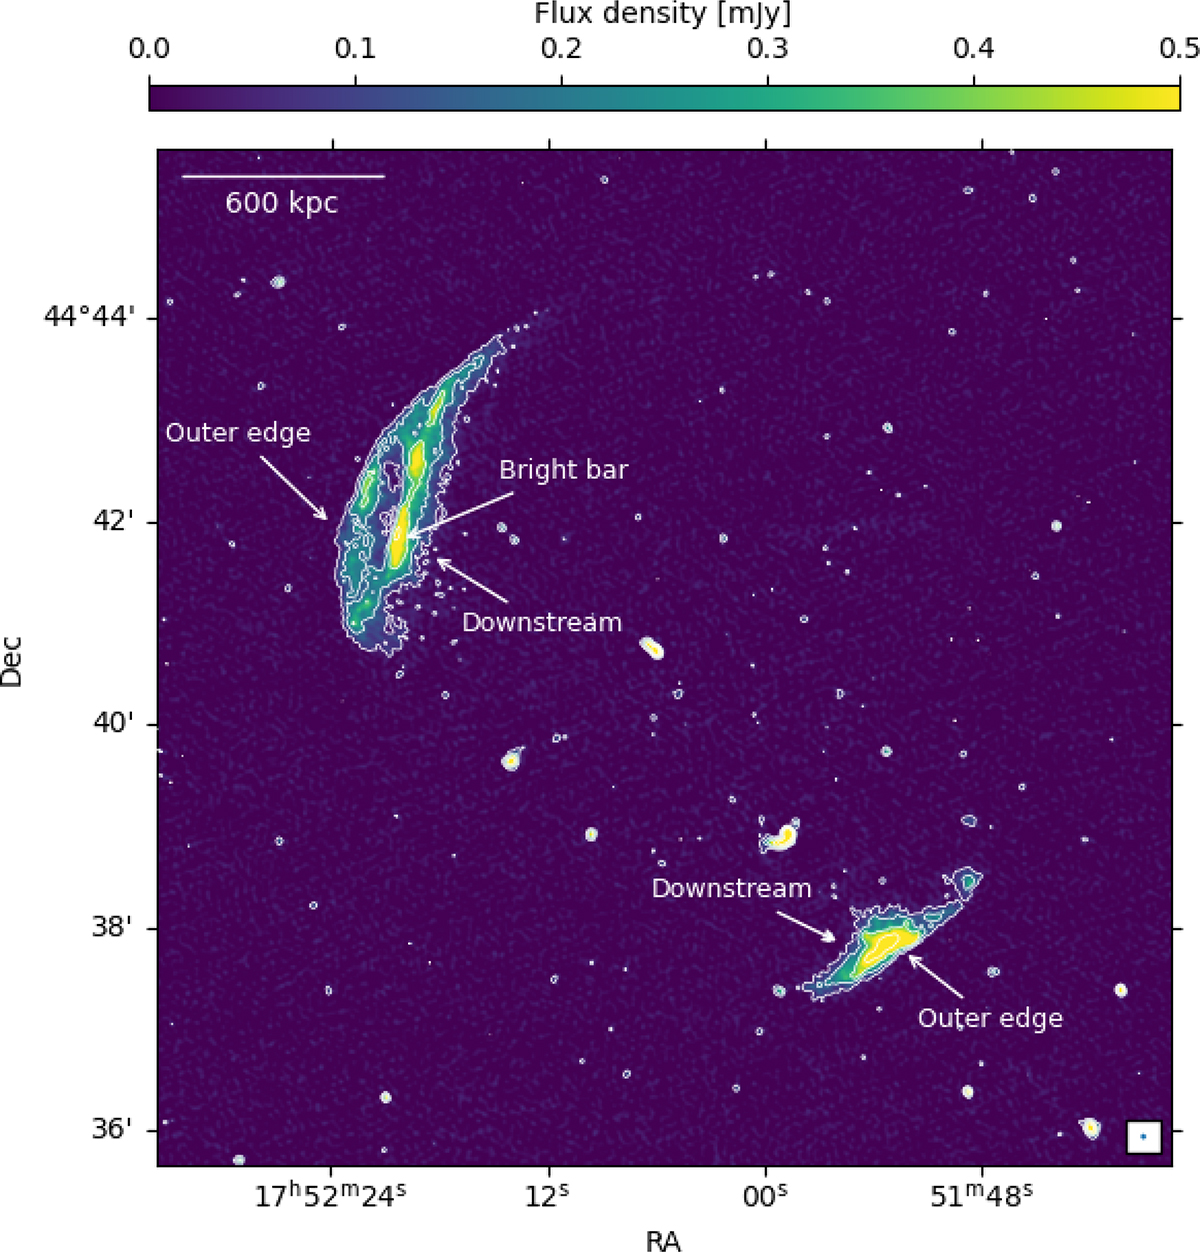
Fig. 2.
Download original image
Band 4 (650 MHz) uGMRT image of MACS J1752+4440. This image, with a resolution of 3″ × 3″, is the highest resolution image obtained so far for this cluster. The different structures are labeled in white. The outer edge component outlines the possible position of the merger shock that generated the NE relic, and the bright bar is a substructure present in the downstream region of the first component. The SW relic shows no substructures at this resolution. Contours start at 3σrms and are separated by a factor of two. The beam and scale bar are shown at the bottom and top of the image, respectively.
Current usage metrics show cumulative count of Article Views (full-text article views including HTML views, PDF and ePub downloads, according to the available data) and Abstracts Views on Vision4Press platform.
Data correspond to usage on the plateform after 2015. The current usage metrics is available 48-96 hours after online publication and is updated daily on week days.
Initial download of the metrics may take a while.