Fig. 3.
Download original image
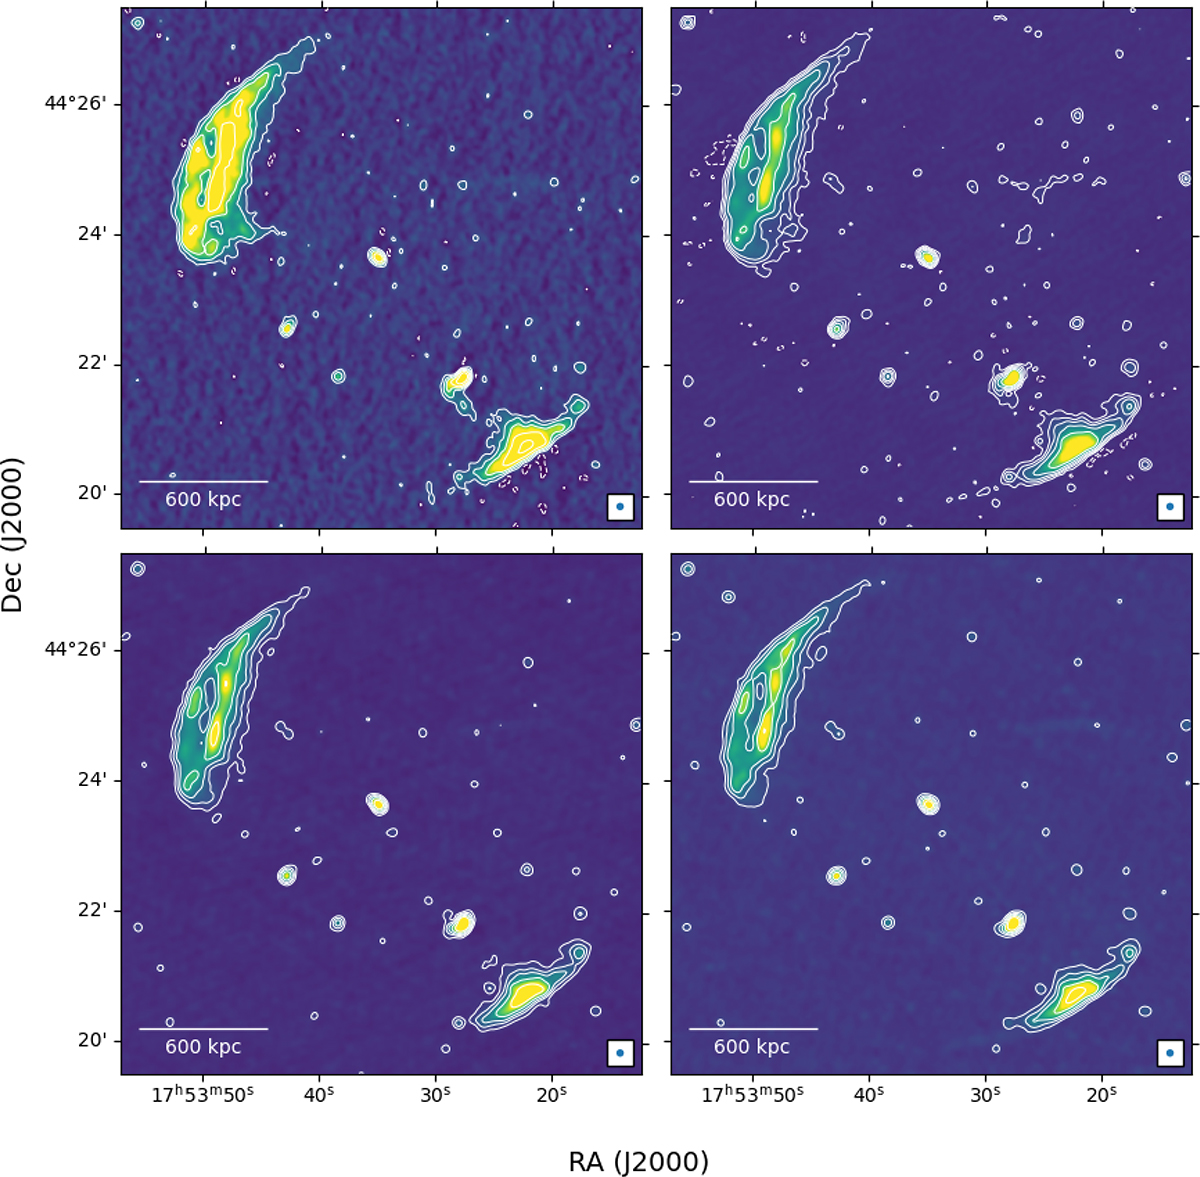
Radio images of the MACS J1752+4440 cluster at 7″ resolution. Top Left: LOFAR image at 144 MHz with noise of σrms, 144 = 280 μJy beam−1. Top Right: uGMRT image at 416 MHz with noise of σrms, 416 = 70 μJy beam−1. Bottom Left: uGMRT image at 650 MHz with noise of σrms, 650 = 23 μJy beam−1. Bottom Right: JVLA image at 1.6 GHz with noise of σrms, 1600 = 15 μJy beam−1. Images have a common angular resolution of 7″ × 7″ and contour levels are drawn at [ − 3, 3, 9, 18, 36, 72]×σrms; the negative contour is shown as a dashed line. The color scale is logarithmic, and beam and scale bar are shown at the bottom of the images.
Current usage metrics show cumulative count of Article Views (full-text article views including HTML views, PDF and ePub downloads, according to the available data) and Abstracts Views on Vision4Press platform.
Data correspond to usage on the plateform after 2015. The current usage metrics is available 48-96 hours after online publication and is updated daily on week days.
Initial download of the metrics may take a while.