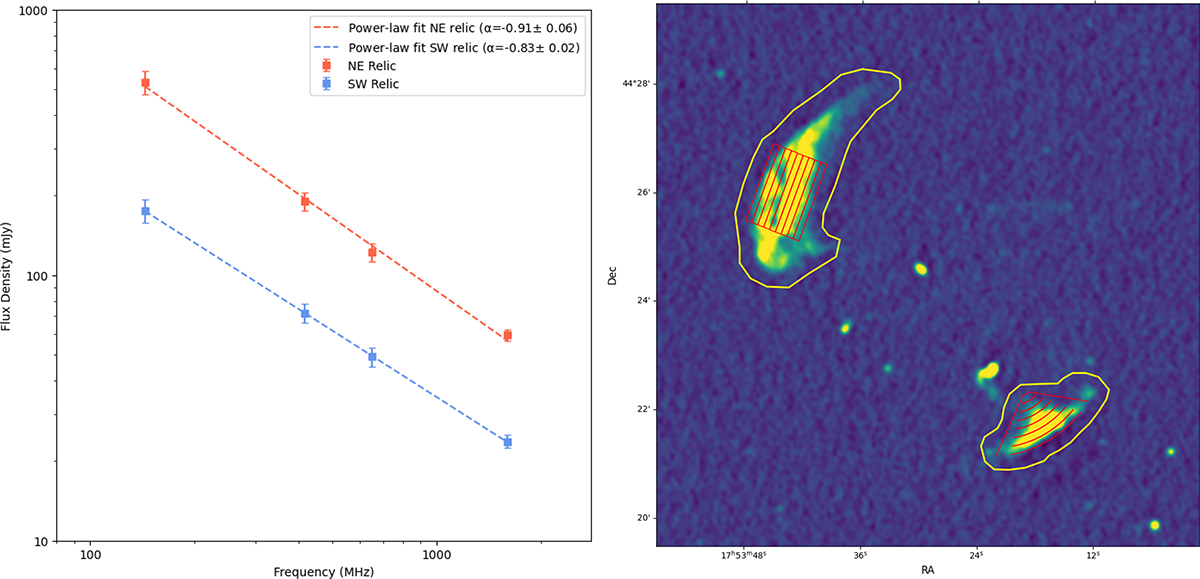
Fig. 4.
Download original image
Left: Spectra for the NE (red) and SW (blue) relic, fitted by two power laws. Right: High-resolution LOFAR continuum image at 144 MHz with the regions used to estimate the flux density of the two relics overlaid in yellow. In addition, the regions used to produce the brightness and spectral index profiles are overlaid in red along the relics.
Current usage metrics show cumulative count of Article Views (full-text article views including HTML views, PDF and ePub downloads, according to the available data) and Abstracts Views on Vision4Press platform.
Data correspond to usage on the plateform after 2015. The current usage metrics is available 48-96 hours after online publication and is updated daily on week days.
Initial download of the metrics may take a while.