Open Access
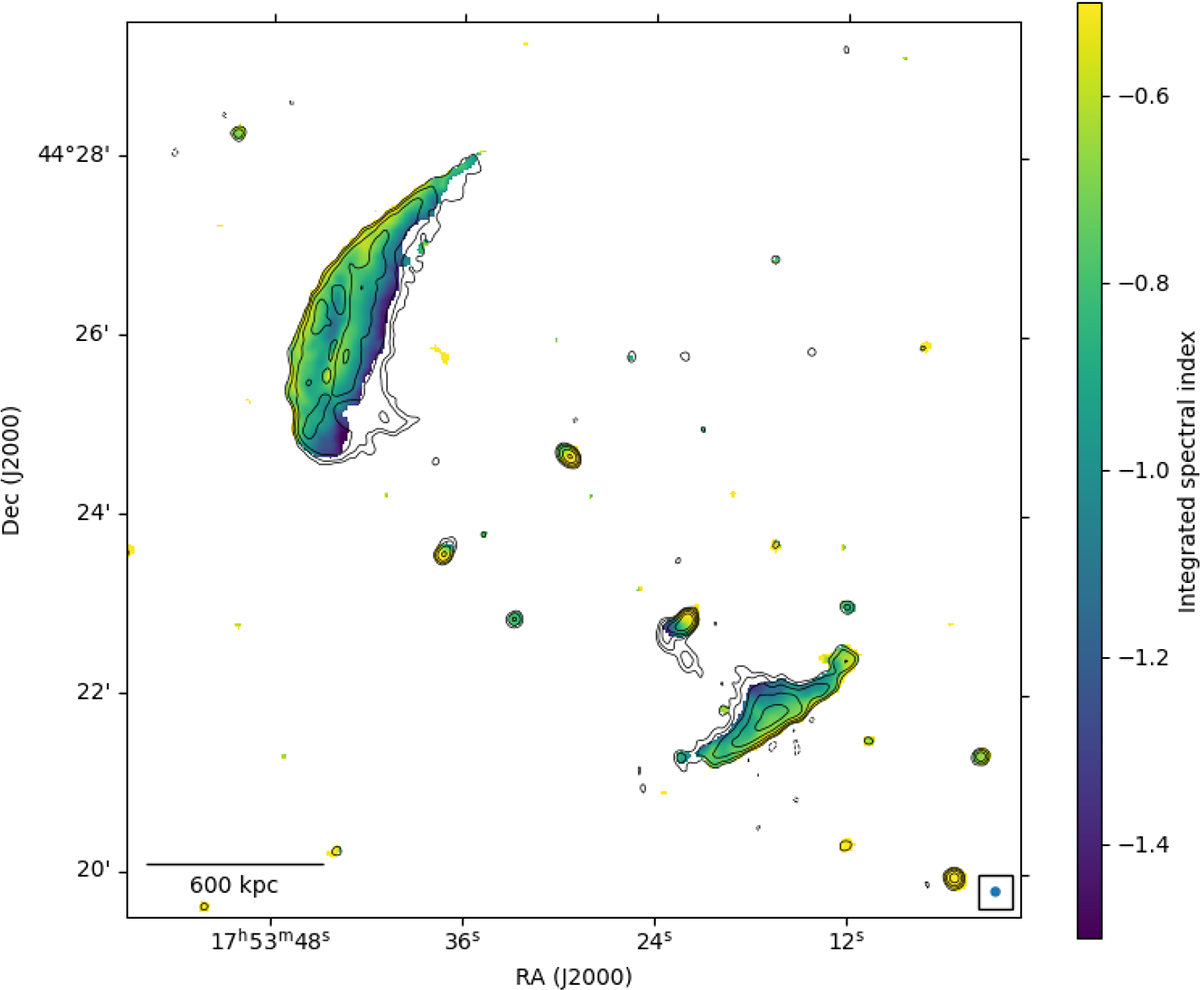
Fig. 7.
Download original image
Spectral index map, obtained from fitting the four measurements in each pixel above the 3σrms level. Contours are drawn from the LOFAR 144 MHz image, starting at the 3σrms level and spaced by factors of two.
Current usage metrics show cumulative count of Article Views (full-text article views including HTML views, PDF and ePub downloads, according to the available data) and Abstracts Views on Vision4Press platform.
Data correspond to usage on the plateform after 2015. The current usage metrics is available 48-96 hours after online publication and is updated daily on week days.
Initial download of the metrics may take a while.