Fig. 8.
Download original image
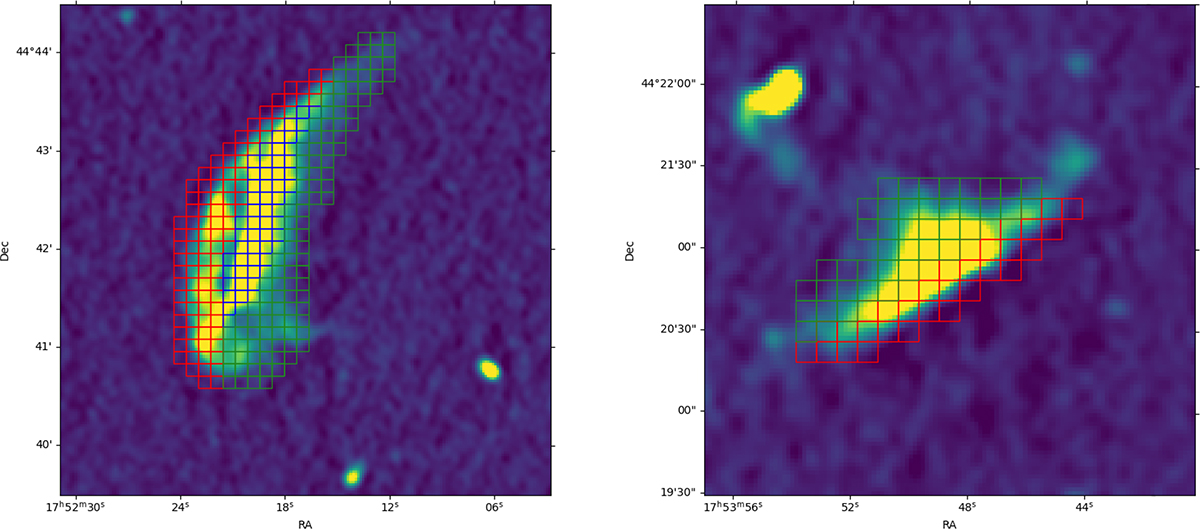
Zoom-in view of the NE and SW radio relics, with selected regions for the curvature study overlaid in different colors. The three components of the NE relic are divided as follows: red outlines the position of the outer edge, blue traces the bright bar, and green marks the downstream regions. Similarly, the shock front and the downstream regions are selected along the SW relic. The same colors are used to represent the structures in the following plots.
Current usage metrics show cumulative count of Article Views (full-text article views including HTML views, PDF and ePub downloads, according to the available data) and Abstracts Views on Vision4Press platform.
Data correspond to usage on the plateform after 2015. The current usage metrics is available 48-96 hours after online publication and is updated daily on week days.
Initial download of the metrics may take a while.