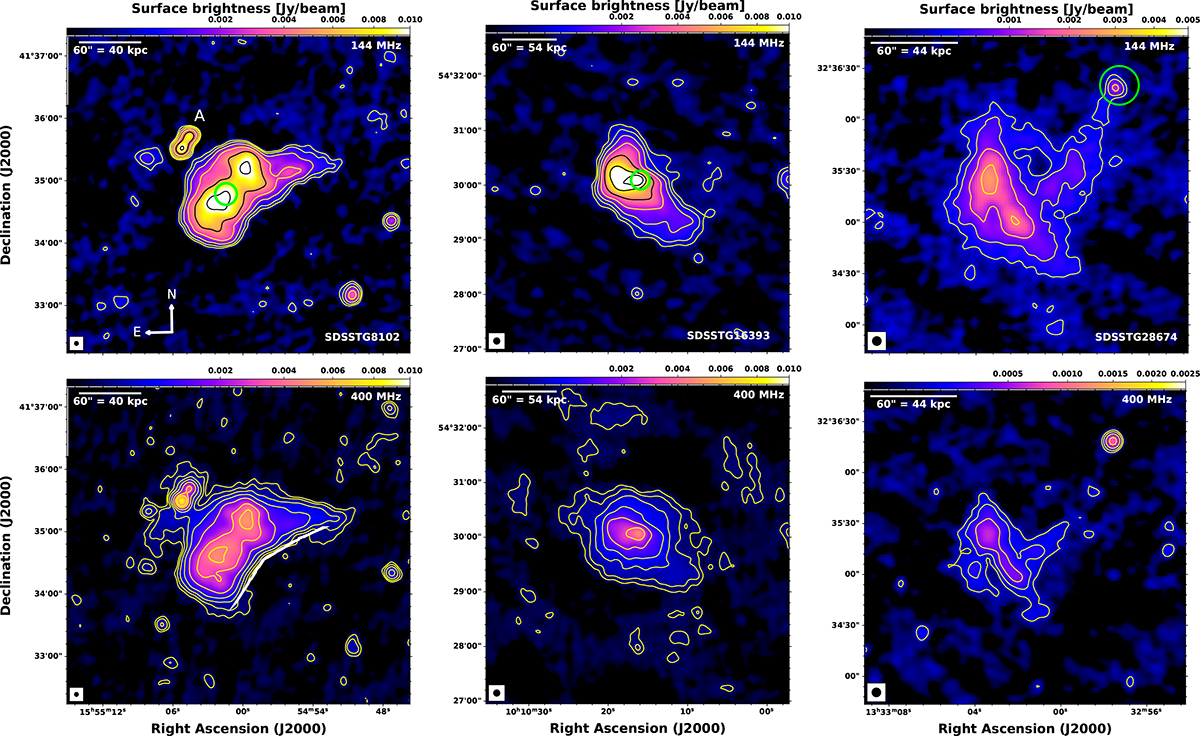
Fig. 1.
Download original image
Left panel: LOFAR (upper) and uGMRT (lower) surface brightness maps of SDSSTG8102 shown in colour. The contours start with 3σrms × [1, 2, 4,...], with σrms = 110 μJy beam−1 (at 144 MHz) and 30.5 μJy beam−1 (at 400 MHz). The green circle marks the BGG of the group. The white line in the lower image shows the location of the change in surface brightness. Middle panel: Radio surface brightness map for SDSSTG16393 (at 8″ resolution) shown at both frequencies and with a similar contour level as the upper panel. The rms values are σ144 MHz = 92 μJy beam−1 (upper) and σ400 MHz = 32 μJy beam−1 (lower). Right panel: Same but for SDSSTG28674 (at 7″ resolution) and with similar contour levels as the left panel. The rms values are σ144 MHz = 85.1 μJy beam−1 (upper) and σ400 MHz = 28.7 μJy beam−1 (lower).
Current usage metrics show cumulative count of Article Views (full-text article views including HTML views, PDF and ePub downloads, according to the available data) and Abstracts Views on Vision4Press platform.
Data correspond to usage on the plateform after 2015. The current usage metrics is available 48-96 hours after online publication and is updated daily on week days.
Initial download of the metrics may take a while.