Fig. 2.
Download original image
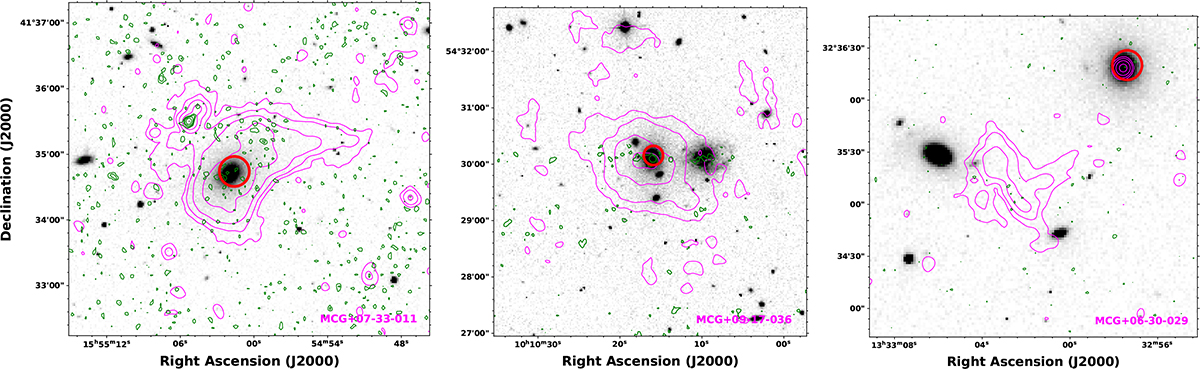
Left: SDSS i-band image of SDSSTG8102 shown in colour (grey). The overlaid magenta contours are from uGMRT 400 MHz, starting with 3σrms × [1, 2, 4,...], where σrms = 30.5 μJy beam−1. The green contours are from the VLASS 3.0 GHz image at 2″ resolution, where the contour levels are 3σrms × [1, 2, 4], with σrms = 108 μJy beam−1. The red circle indicates the BGG of the group. Middle: Same but for SDSSTG16393 with the same contour level from uGMRT and an rms of 32 μJy beam−1. The green contours are from the VLASS 3.0 GHz map. Right: Same but for SDSSTG28674 with the same contour level as the upper panels and an rms of 28.7 μJy beam−1. The green contours are from the VLASS map at a similar significance.
Current usage metrics show cumulative count of Article Views (full-text article views including HTML views, PDF and ePub downloads, according to the available data) and Abstracts Views on Vision4Press platform.
Data correspond to usage on the plateform after 2015. The current usage metrics is available 48-96 hours after online publication and is updated daily on week days.
Initial download of the metrics may take a while.