Open Access
Fig. 3.
Download original image
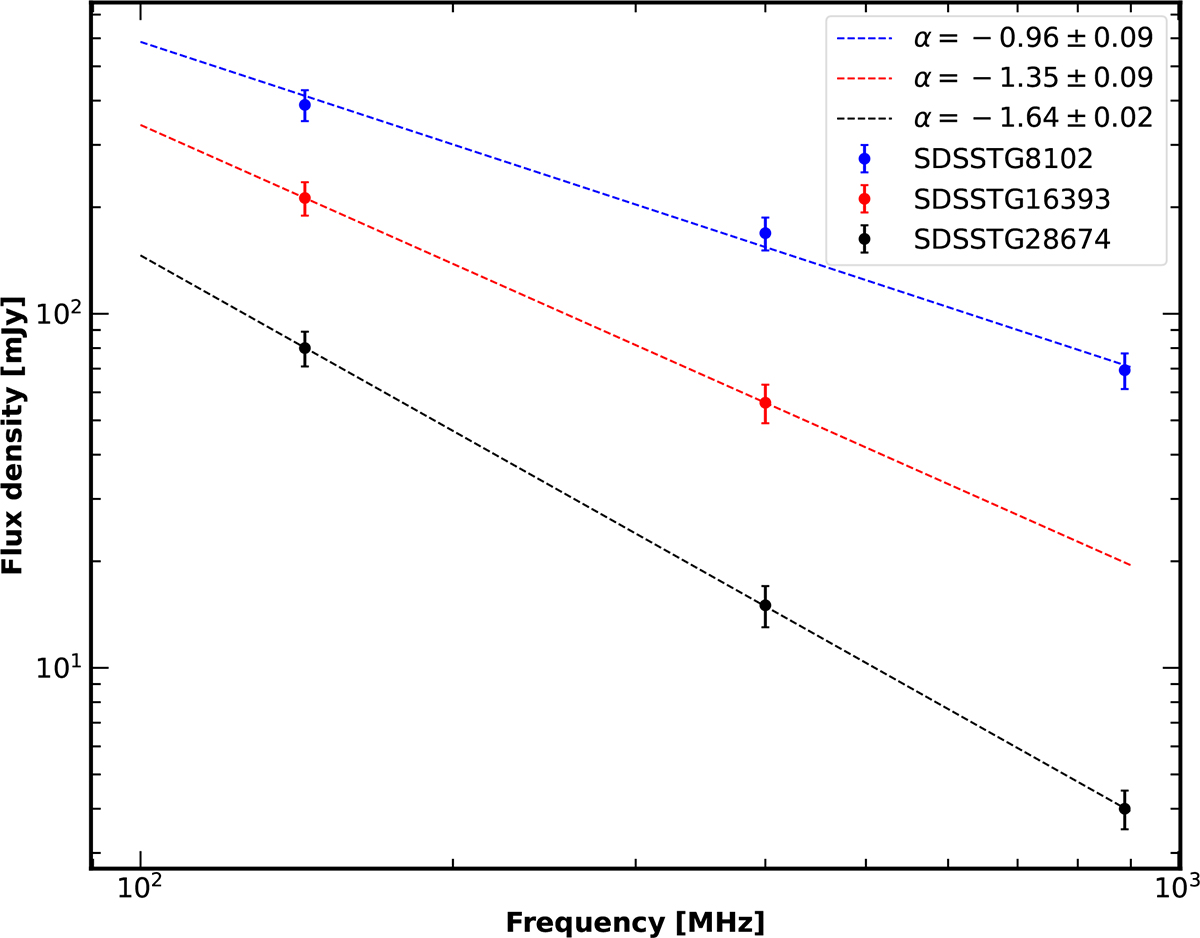
Integrated spectrum of the central radio emission for each group (at different colours) between 144 MHz and 887 MHz. The dashed lines represent the fitted single power law. We estimated the average flux density from a common region at each frequency for the individual groups.
Current usage metrics show cumulative count of Article Views (full-text article views including HTML views, PDF and ePub downloads, according to the available data) and Abstracts Views on Vision4Press platform.
Data correspond to usage on the plateform after 2015. The current usage metrics is available 48-96 hours after online publication and is updated daily on week days.
Initial download of the metrics may take a while.