Open Access
Fig. A.1.
Download original image
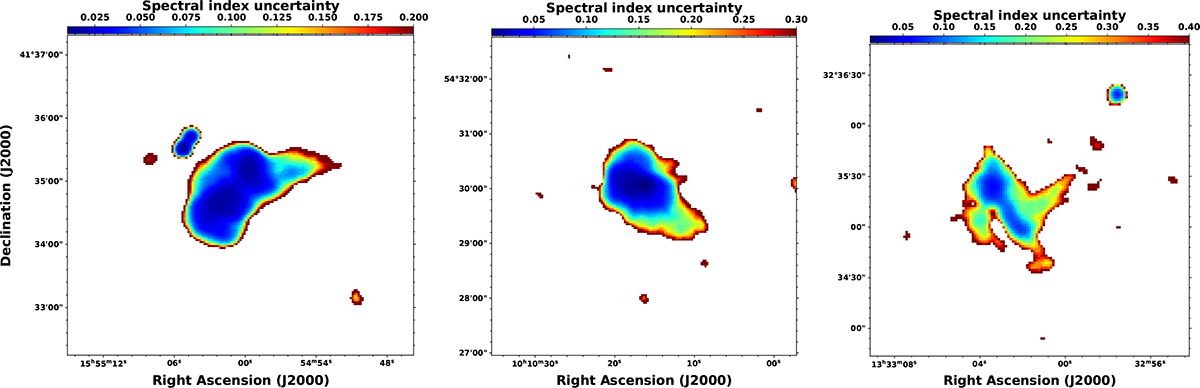
Left: Spectral index error map between 144 and 400 MHz is shown for SDSSTG8102. Middle: Same but for SDSSTG16393. Right: Spectral error map for SDSSTG28674 in a colour scale.
Current usage metrics show cumulative count of Article Views (full-text article views including HTML views, PDF and ePub downloads, according to the available data) and Abstracts Views on Vision4Press platform.
Data correspond to usage on the plateform after 2015. The current usage metrics is available 48-96 hours after online publication and is updated daily on week days.
Initial download of the metrics may take a while.