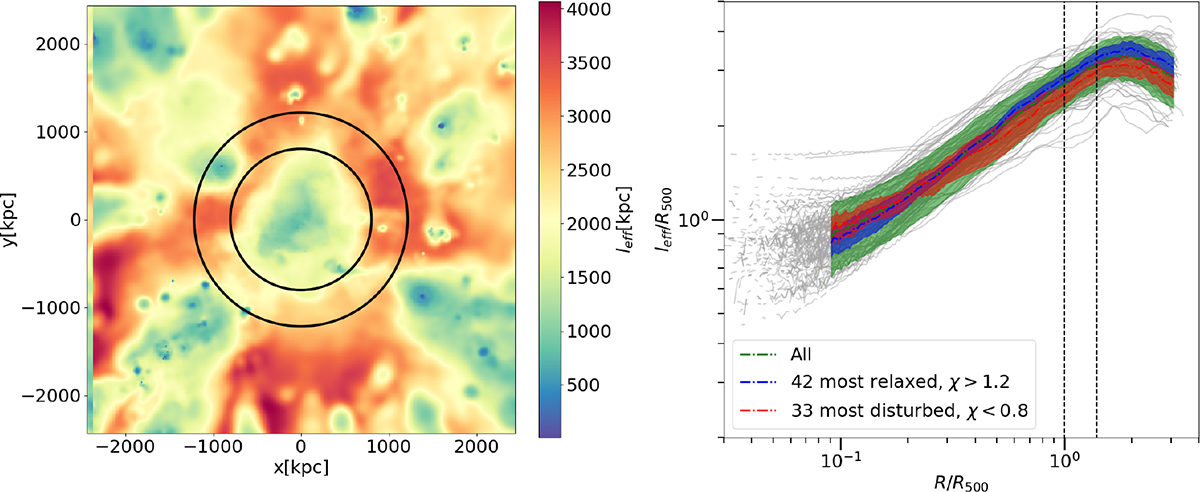
Fig. 1.
Download original image
Left: effective length map for the main cluster of region 211 of the snapshot 101, at z = 0.817. The two rings correspond to R500 and R200. Right: 1D profiles of the effective length for all clusters in our sample. We give in addition the median leff profiles computed for the full sample (green), the most relaxed (blue) and the most disturbed (red) clusters of the sample. The vertical dashed lines correspond to the 1.0R500 and 1.4R500 ∼ R200, while the shaded areas correspond to the 1σ dispersion regions.
Current usage metrics show cumulative count of Article Views (full-text article views including HTML views, PDF and ePub downloads, according to the available data) and Abstracts Views on Vision4Press platform.
Data correspond to usage on the plateform after 2015. The current usage metrics is available 48-96 hours after online publication and is updated daily on week days.
Initial download of the metrics may take a while.