Fig. A.1.
Download original image
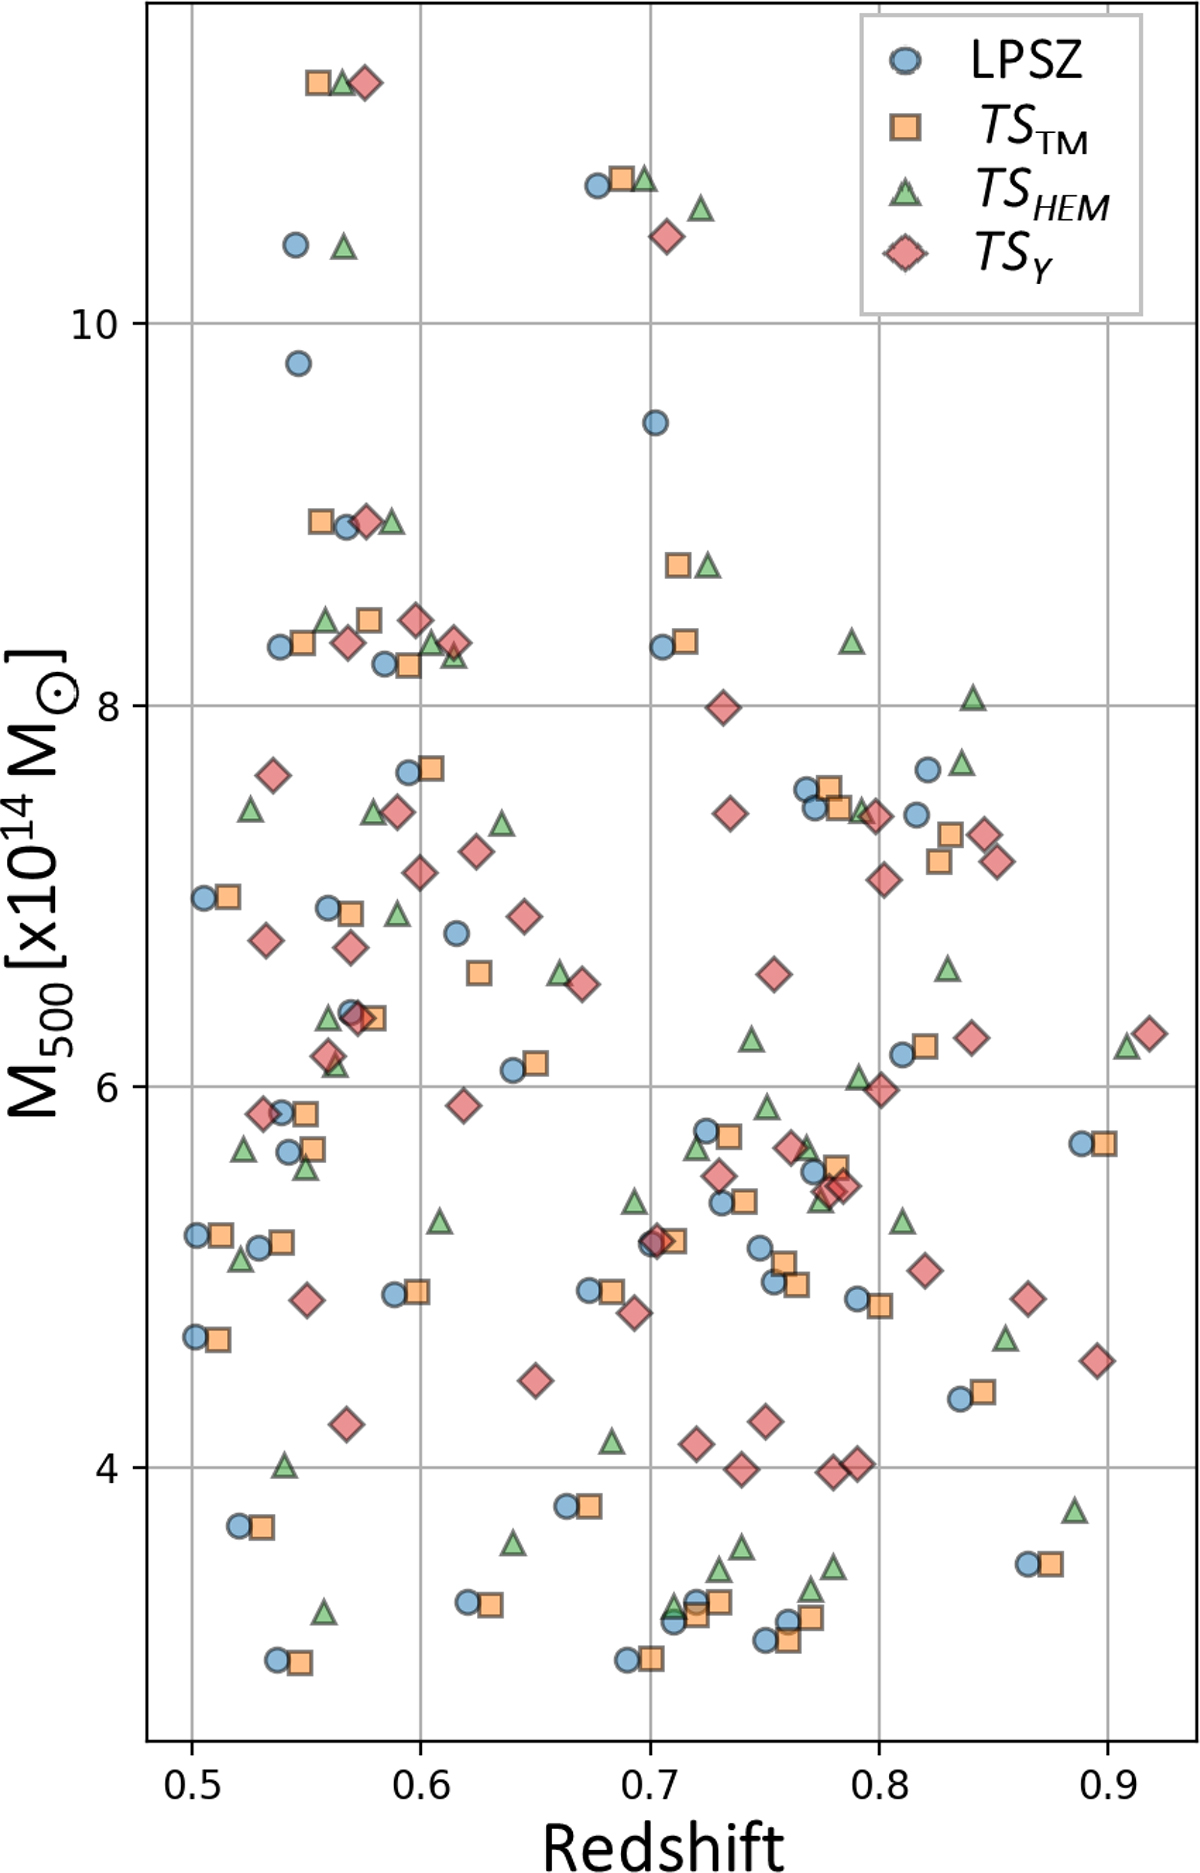
Distribution of the NIKA2 LPSZ Twin Sample in the mass-redshift plane, figure taken from (Paliwal et al. 2022). The blue circles represent the true LPSZ clusters, while the other markers correspond to their simulated twins, within the three different Twin Samples. The orange squares correspond to the total mass twin sample, the green triangles to the hydrostatic mass twin sample, and the red diamonds to the Y500 twin sample. The redshifts of the simulated twins have been artificially set to the redshifts of their real-life counterparts.
Current usage metrics show cumulative count of Article Views (full-text article views including HTML views, PDF and ePub downloads, according to the available data) and Abstracts Views on Vision4Press platform.
Data correspond to usage on the plateform after 2015. The current usage metrics is available 48-96 hours after online publication and is updated daily on week days.
Initial download of the metrics may take a while.