Open Access
Fig. B.1.
Download original image
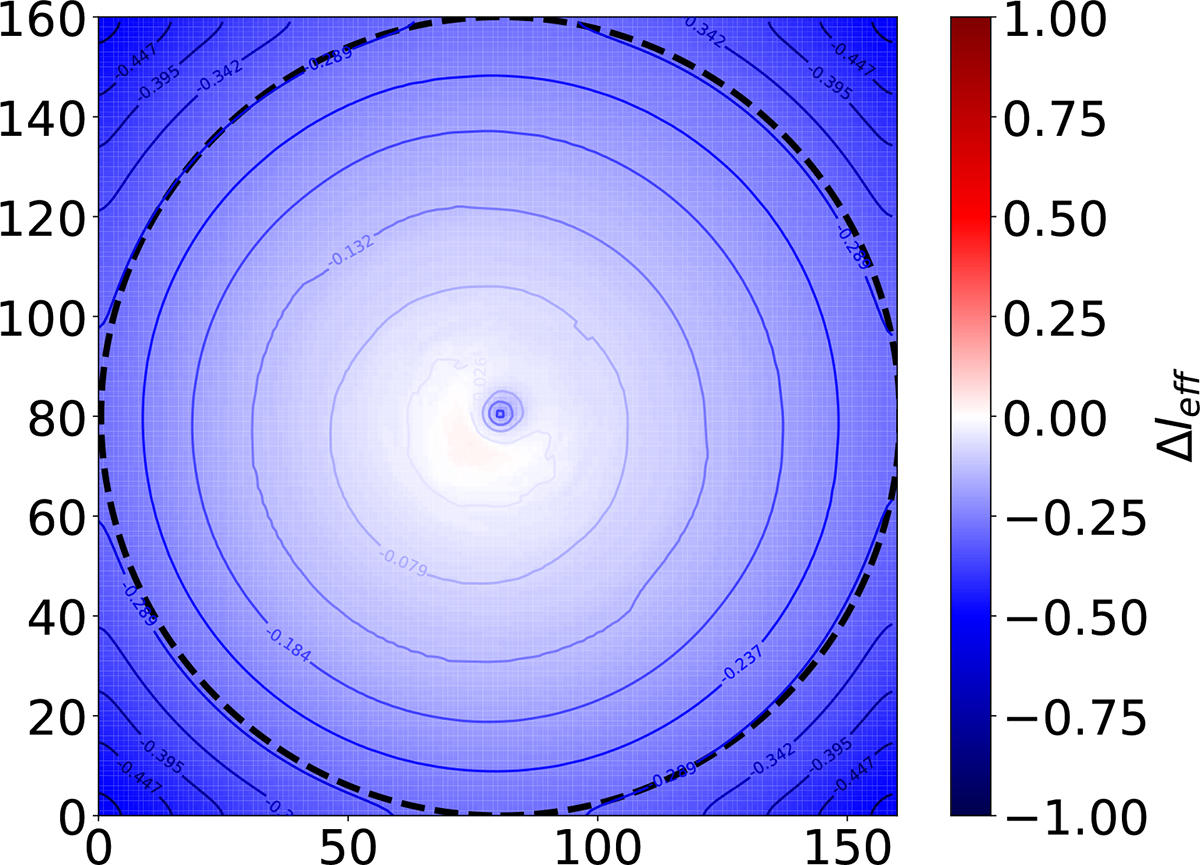
Stacked comparative map of the GHP-inferred and Vikhlinin-inferred effective length maps. The dashed line represents the spatial extension of the map, covering R200 for each cluster. The contours span the range ±50% while the colorbar spans the range ±100%.
Current usage metrics show cumulative count of Article Views (full-text article views including HTML views, PDF and ePub downloads, according to the available data) and Abstracts Views on Vision4Press platform.
Data correspond to usage on the plateform after 2015. The current usage metrics is available 48-96 hours after online publication and is updated daily on week days.
Initial download of the metrics may take a while.