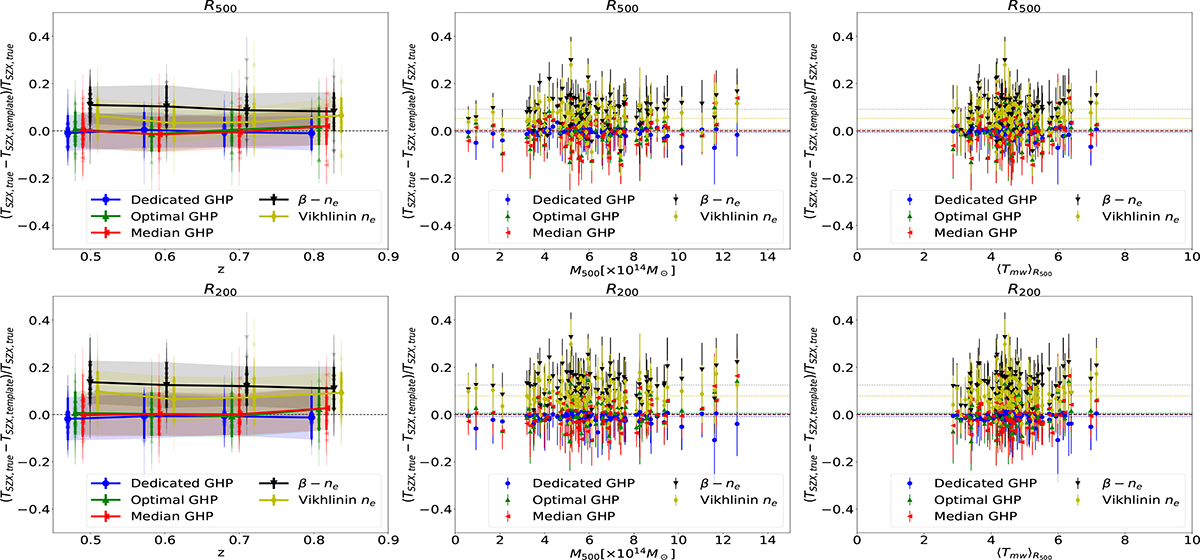
Fig. C.1.
Download original image
Median bias and scatter between TSZX, true and TSZX, template, for all the clusters in the sample, depending on z (left column), M500 (middle column) and ![]() (right column). The coloured dashed lines in the mass and temperature panels correspond to the median biases for each model. Top row: Biases and scatters taken at R500. Bottom row: Biases and scatters taken at R200.
(right column). The coloured dashed lines in the mass and temperature panels correspond to the median biases for each model. Top row: Biases and scatters taken at R500. Bottom row: Biases and scatters taken at R200.
Current usage metrics show cumulative count of Article Views (full-text article views including HTML views, PDF and ePub downloads, according to the available data) and Abstracts Views on Vision4Press platform.
Data correspond to usage on the plateform after 2015. The current usage metrics is available 48-96 hours after online publication and is updated daily on week days.
Initial download of the metrics may take a while.