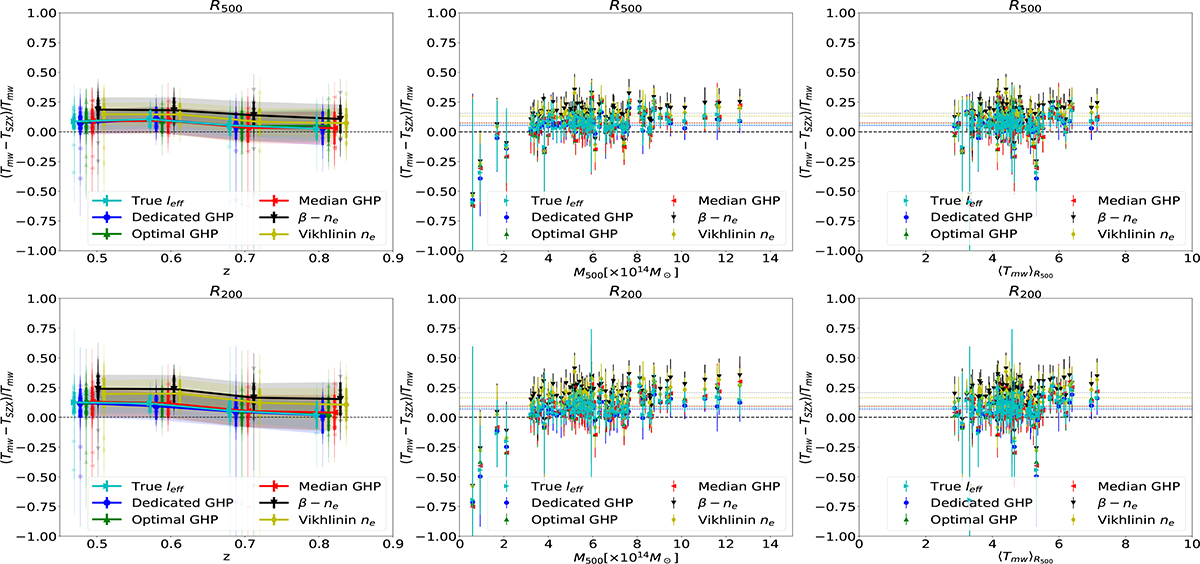
Fig. C.2.
Download original image
Comparison between TSZX, obtained using different models, and Tmw for all the clusters in our sample, depending on their redshift, mass, and mean temperature at R500. The coloured dashed lines in the mass and temperature panels correspond to the median biases for each model. Top row : Biases and scatters measured at R500. Bottom row : Biases and scatters measured at R200.
Current usage metrics show cumulative count of Article Views (full-text article views including HTML views, PDF and ePub downloads, according to the available data) and Abstracts Views on Vision4Press platform.
Data correspond to usage on the plateform after 2015. The current usage metrics is available 48-96 hours after online publication and is updated daily on week days.
Initial download of the metrics may take a while.