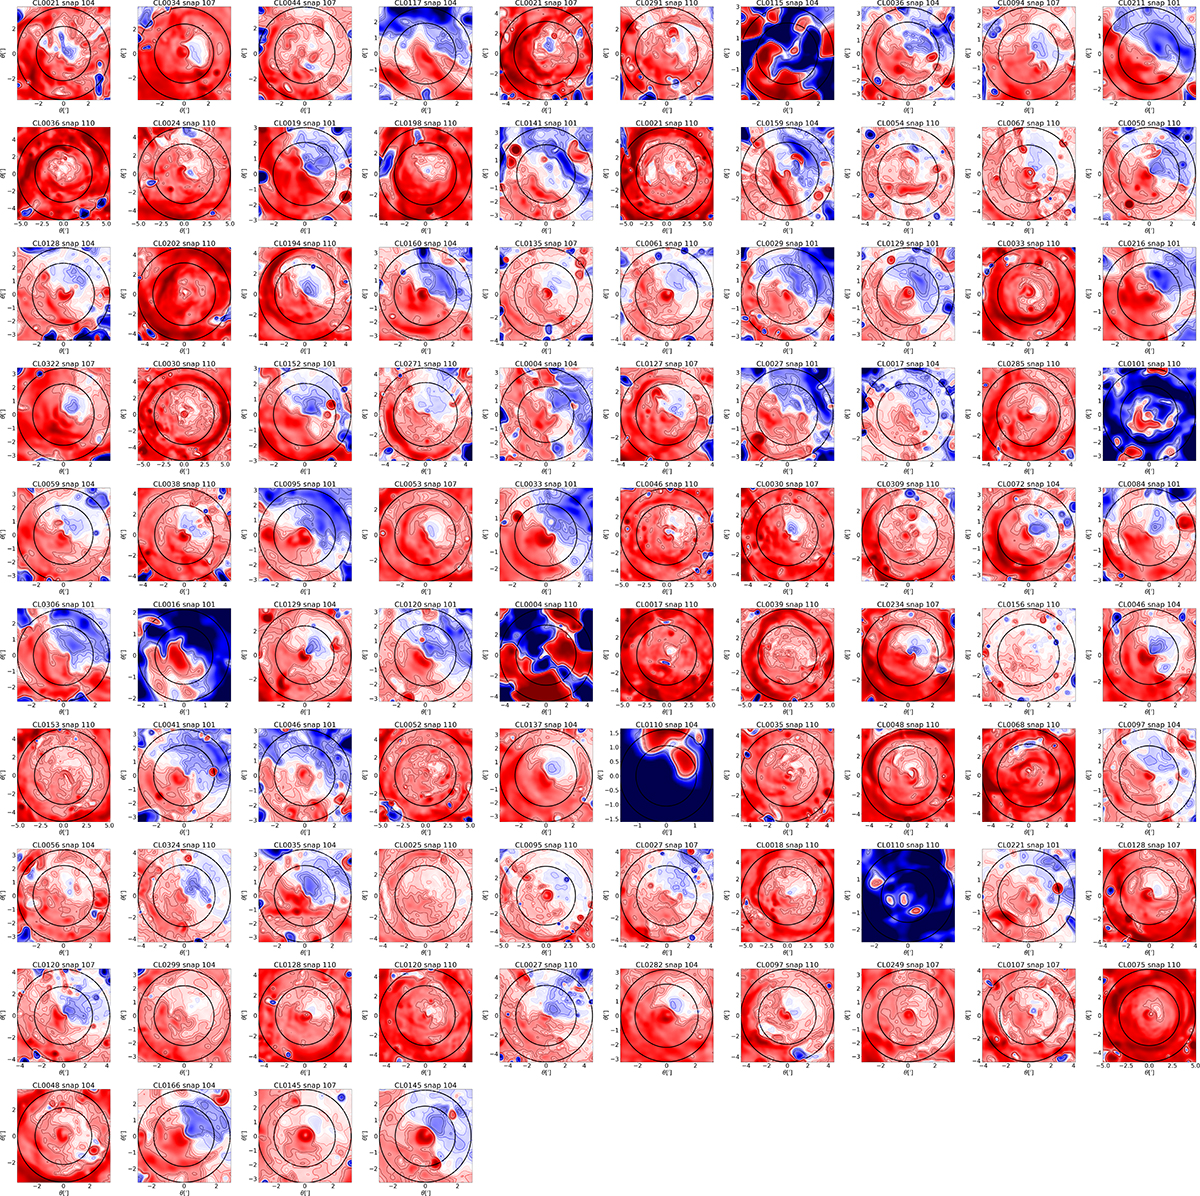
Fig. D.2.
Download original image
Comparison between TSZX and Tmw maps obtained for all the clusters in our sample, using the true effective length map for each cluster. The maps are ordered by relaxation parameter at R500, χ500. The top left clusters have the lowest chi500, i.e. are the most disturbed clusters, up to the bottom right clusters which are the most relaxed systems. The colormaps span the range ±50%, while the contours span the range ±10%.
Current usage metrics show cumulative count of Article Views (full-text article views including HTML views, PDF and ePub downloads, according to the available data) and Abstracts Views on Vision4Press platform.
Data correspond to usage on the plateform after 2015. The current usage metrics is available 48-96 hours after online publication and is updated daily on week days.
Initial download of the metrics may take a while.