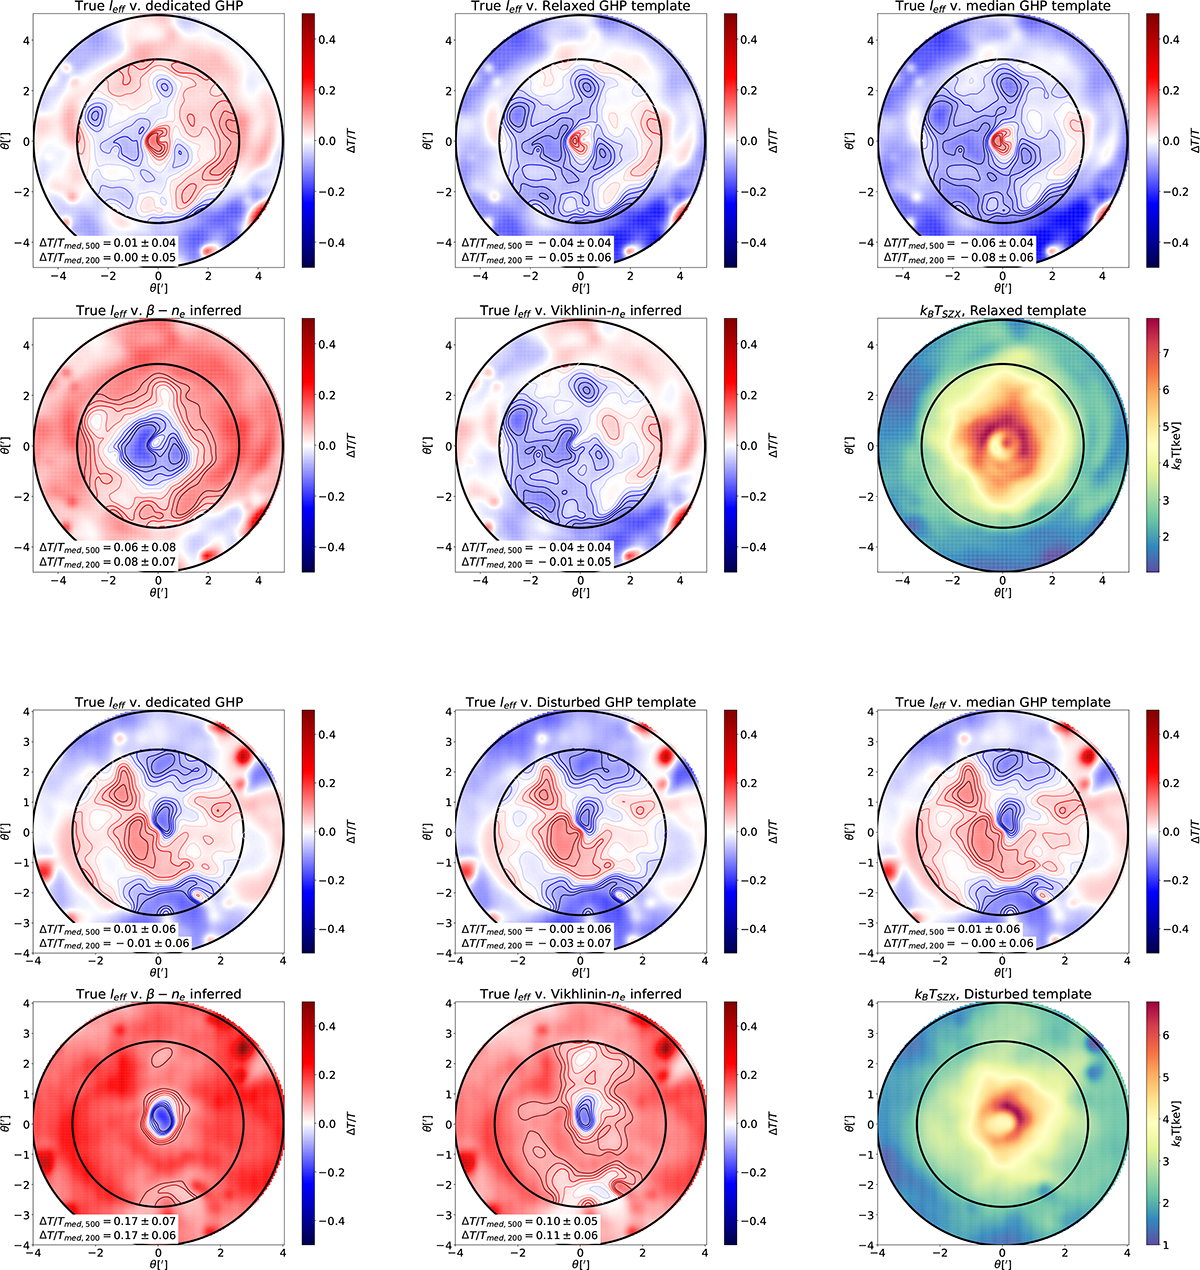
Fig. 2.
Download original image
Two examples of comparison between TSZX derived using the true leff and TSZX obtained using a modeled effective length. The two rings correspond to R500 and R200. The color scale of the comparative maps ranges from −50% to +50%. The levels of the contours inside R500 range from −10% to +10%. For each of the two clusters, the final panel shows the TSZX map obtained using the optimal (Relaxed, Disturbed or Median) GHP template. Top two rows: main cluster of the region 75 of the snapshot 110, at z = 0.490. Bottom two rows: main cluster of the region 135 of the snapshot 107, at z = 0.592.
Current usage metrics show cumulative count of Article Views (full-text article views including HTML views, PDF and ePub downloads, according to the available data) and Abstracts Views on Vision4Press platform.
Data correspond to usage on the plateform after 2015. The current usage metrics is available 48-96 hours after online publication and is updated daily on week days.
Initial download of the metrics may take a while.