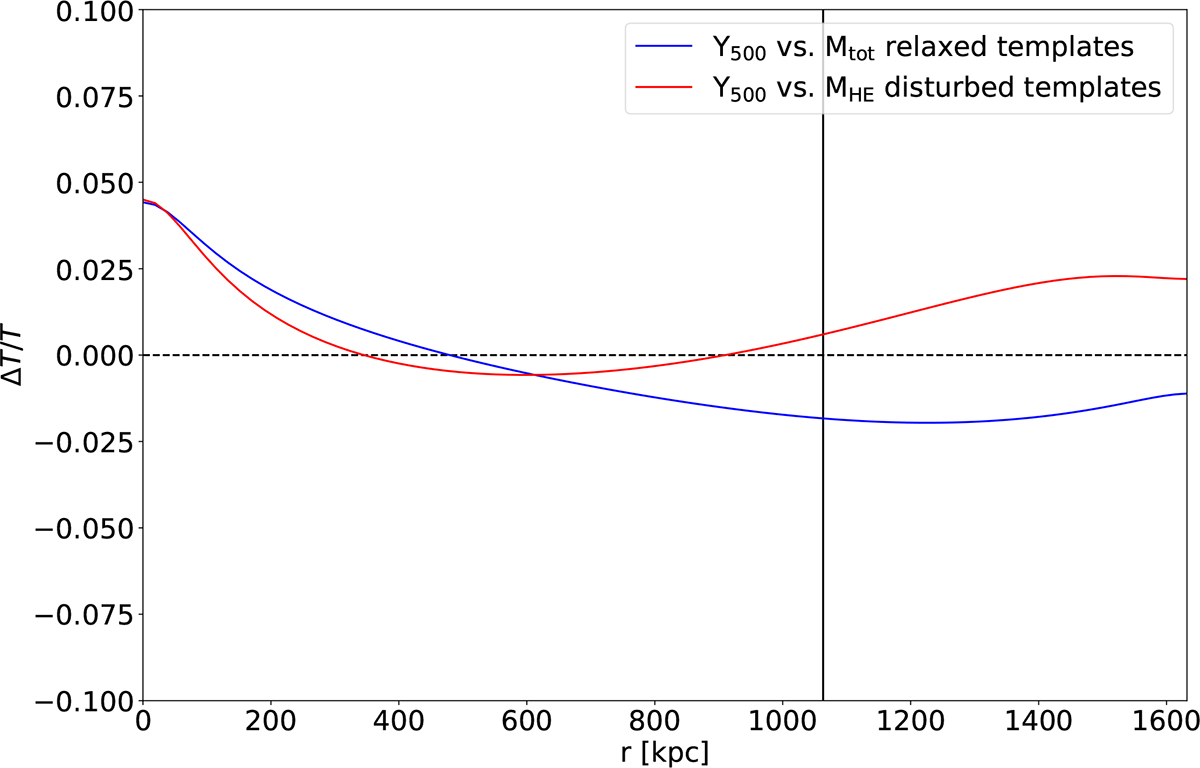
Fig. 8.
Download original image
Radial comparison of the temperature maps obtained using GHP templates calibrated on different Twin Samples, for the main cluster of the region 25 of the snapshot 110, at z = 0.49. We stress that the comparison shown here remains valid for all other clusters at all redshifts in our sample. The blue line shows the comparison of the temperature maps obtained using the relaxed GHP templates calibrated on the Y500 and Mtot Twin Samples. The red line shows the comparison of the TSZX maps obtained using the disturbed GHP templates calibrated on the Y500 and MHE Twin Samples. The vertical black line delimits R500, the radii range up to R200.
Current usage metrics show cumulative count of Article Views (full-text article views including HTML views, PDF and ePub downloads, according to the available data) and Abstracts Views on Vision4Press platform.
Data correspond to usage on the plateform after 2015. The current usage metrics is available 48-96 hours after online publication and is updated daily on week days.
Initial download of the metrics may take a while.