Fig. 1
Download original image
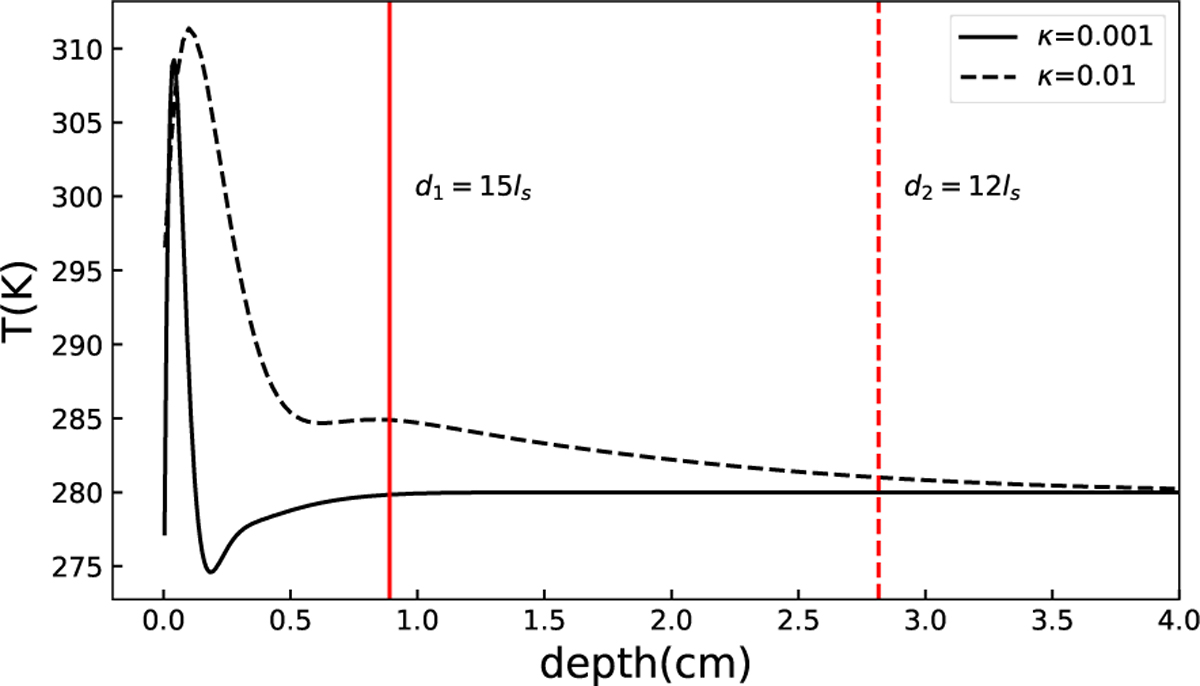
Temperature variations along a radius on the equatorial plane at sunset. Two thermal conductivities κ = 0.001 and 0.01 (given in W m−1 K−1) are adopted. The depth is measured downwards from the surface. The solid and dashed lines denote the depths from which the temperature variation relative to the subsequent mesh layer is less than 0.1% for κ = 0.001 and 0.01, respectively.
Current usage metrics show cumulative count of Article Views (full-text article views including HTML views, PDF and ePub downloads, according to the available data) and Abstracts Views on Vision4Press platform.
Data correspond to usage on the plateform after 2015. The current usage metrics is available 48-96 hours after online publication and is updated daily on week days.
Initial download of the metrics may take a while.