Fig. 8
Download original image
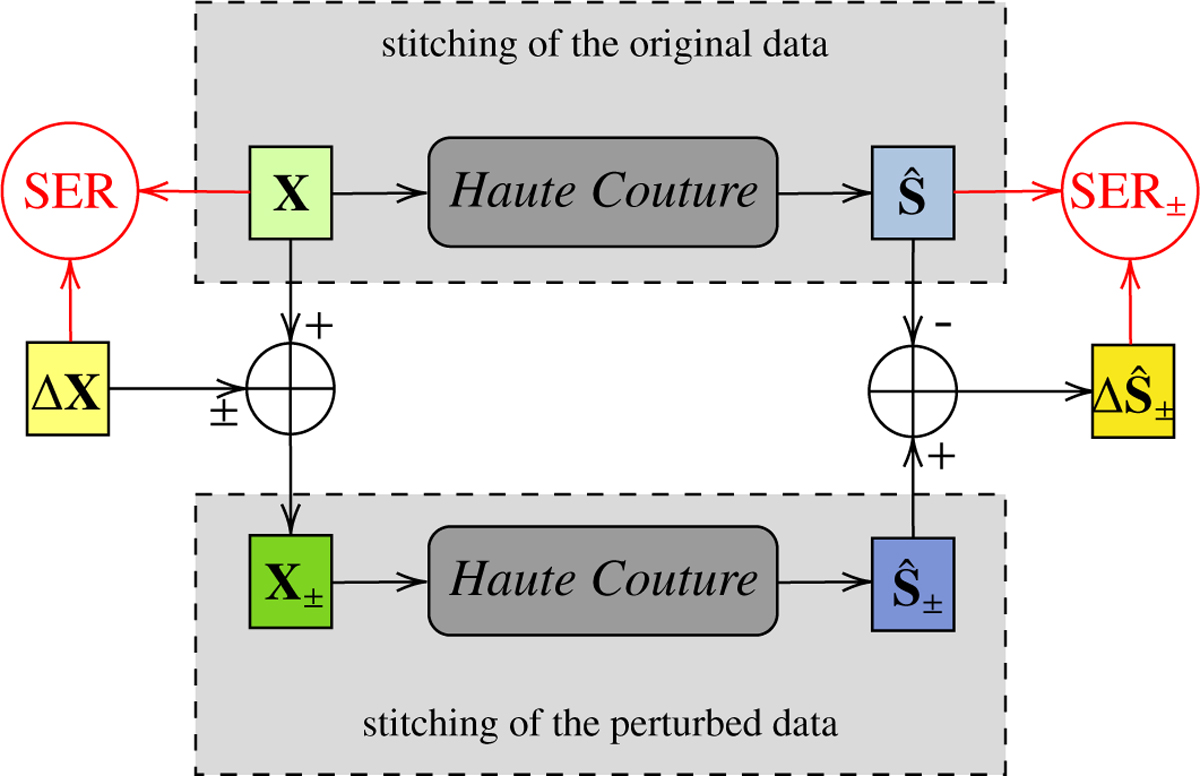
Quantification of the error propagation. The amount of error, SER, before stitching was evaluated from the original data contained in X (light green box) and the error matrix ΔX (light yellow box). The original data X were processed by Haute Couture to produce the stitched spectra ![]() (light blue box). The error matrix ΔX was combined with the original data X to produce the perturbed data X± (dark green box). The perturbed data X± were processed by Haute Couture to produce the stitched spectra
(light blue box). The error matrix ΔX was combined with the original data X to produce the perturbed data X± (dark green box). The perturbed data X± were processed by Haute Couture to produce the stitched spectra ![]() (dark blue box), yielding the propagated error
(dark blue box), yielding the propagated error ![]() (dark yellow box). The amount of error SER± after stitching was evaluated from the stitched original spectra
(dark yellow box). The amount of error SER± after stitching was evaluated from the stitched original spectra ![]() and the propagated errors
and the propagated errors ![]() .
.
Current usage metrics show cumulative count of Article Views (full-text article views including HTML views, PDF and ePub downloads, according to the available data) and Abstracts Views on Vision4Press platform.
Data correspond to usage on the plateform after 2015. The current usage metrics is available 48-96 hours after online publication and is updated daily on week days.
Initial download of the metrics may take a while.