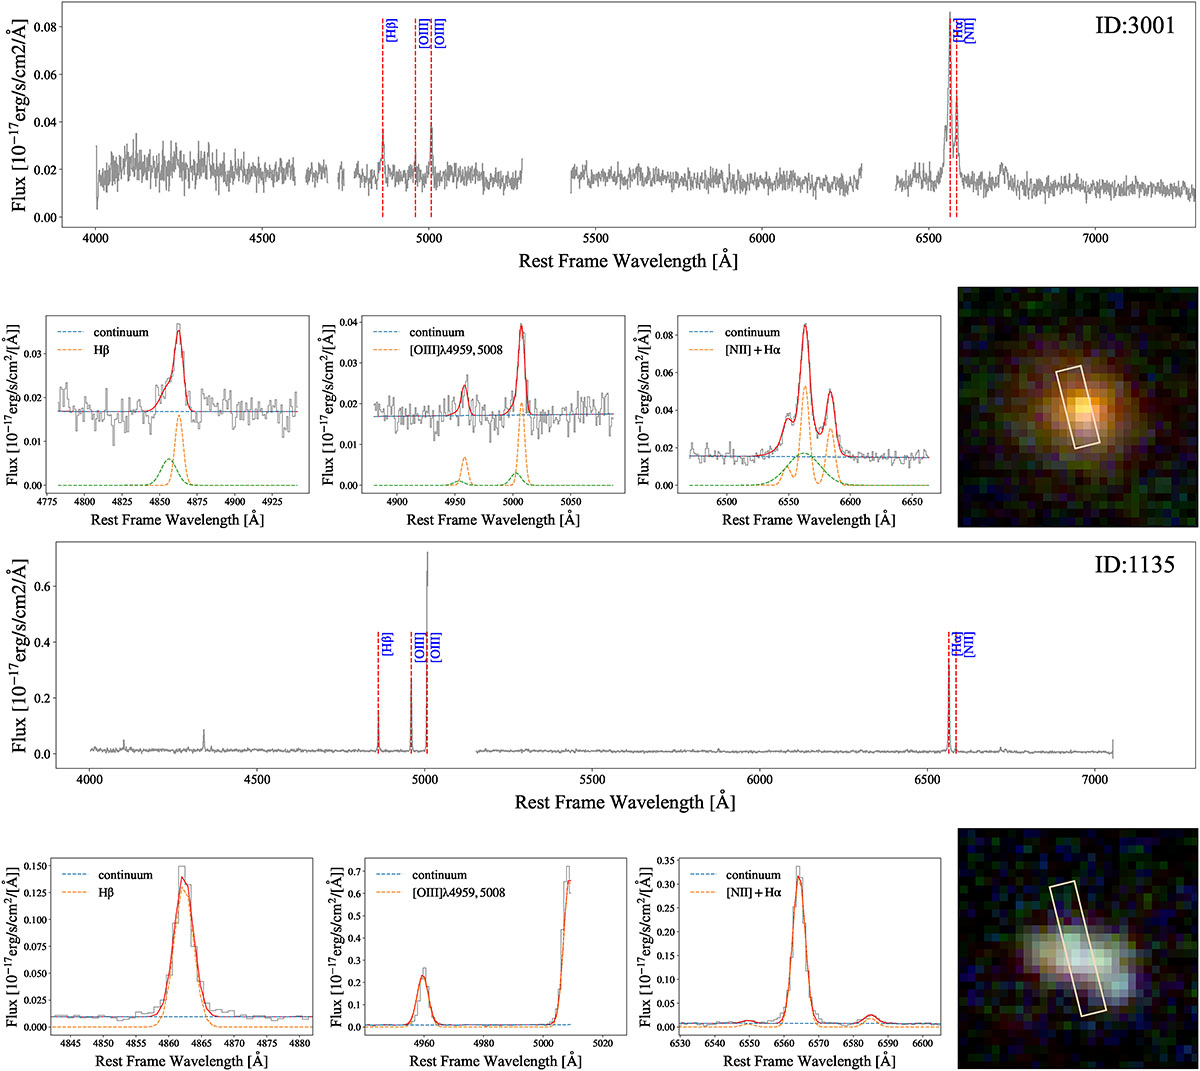
Fig. 2.
Download original image
Integrated 1D spectra and composite false-color images of two galaxies in the sample, with slit IDs 3001 and 1135. The flux density is given in unit of 10−17 erg/s/cm2/Å, and the wavelength is given in rest-frame Angstroms. The slit regions from which the 1D spectra were extracted are overplotted on the galaxy images as light pink boxes. The emission lines were modeled with single Gaussians. For galaxy 3001, which shows broad emission line features, an additional Gaussian component was included (shown by the dotted green line). The flux of the narrow Gaussian components was adopted in the analysis for galaxy 3001. The filters used to create the color images are HST F814W (0.8 μm; blue), JWST F150W2 (1.5 μm; green), and JWST F322W2 (3.2 μm; red). The spectra and images for the remaining galaxies are given in Fig. B.1.
Current usage metrics show cumulative count of Article Views (full-text article views including HTML views, PDF and ePub downloads, according to the available data) and Abstracts Views on Vision4Press platform.
Data correspond to usage on the plateform after 2015. The current usage metrics is available 48-96 hours after online publication and is updated daily on week days.
Initial download of the metrics may take a while.