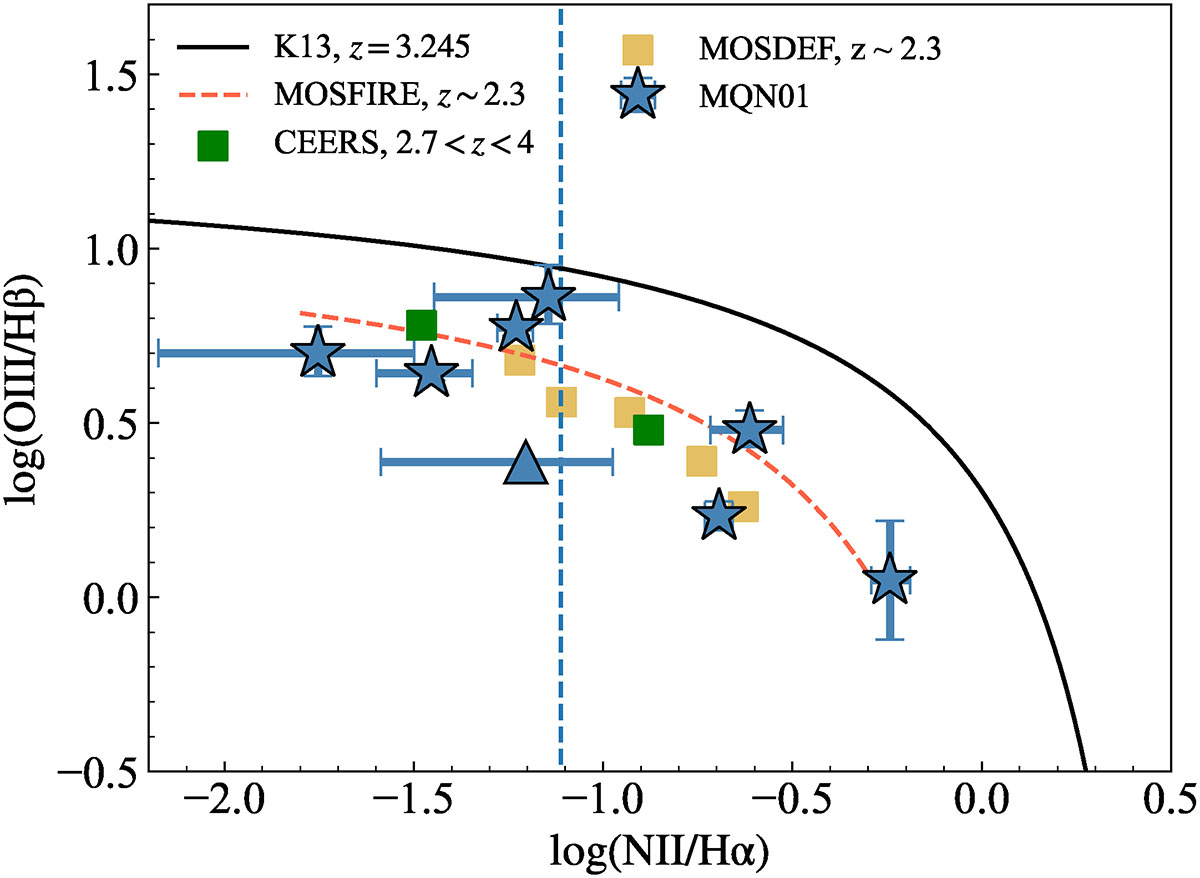
Fig. 3.
Download original image
Baldwin-Phillips-Televich diagram for the MQN01 galaxy sample. The classification curve is from Kewley et al. (2013) with z = 3.245. Galaxies are shown as blue stars. For one galaxy (ID: 6005) without an Hβ detection, a 3σ upper limit is adopted, resulting in a lower limit for [OIII]λ5008/Hβ, shown as a blue triangle. The galaxy whose [OIII] falls within the spectrum detection gap (ID: 3201, see Fig. B.1) is shown as the vertical dashed line at its [NII]λ6585/Hα value. The distribution of the stacked CEERS 2.7 < z < 4.0 sample (Shapley et al. 2023a), stacked MOSDEF z ∼ 2.2 (Sanders et al. 2021), and the best-fit relation for the KBSS-MOSFIRE sample at z ∼ 2.3 (Steidel et al. 2014) are also included.
Current usage metrics show cumulative count of Article Views (full-text article views including HTML views, PDF and ePub downloads, according to the available data) and Abstracts Views on Vision4Press platform.
Data correspond to usage on the plateform after 2015. The current usage metrics is available 48-96 hours after online publication and is updated daily on week days.
Initial download of the metrics may take a while.