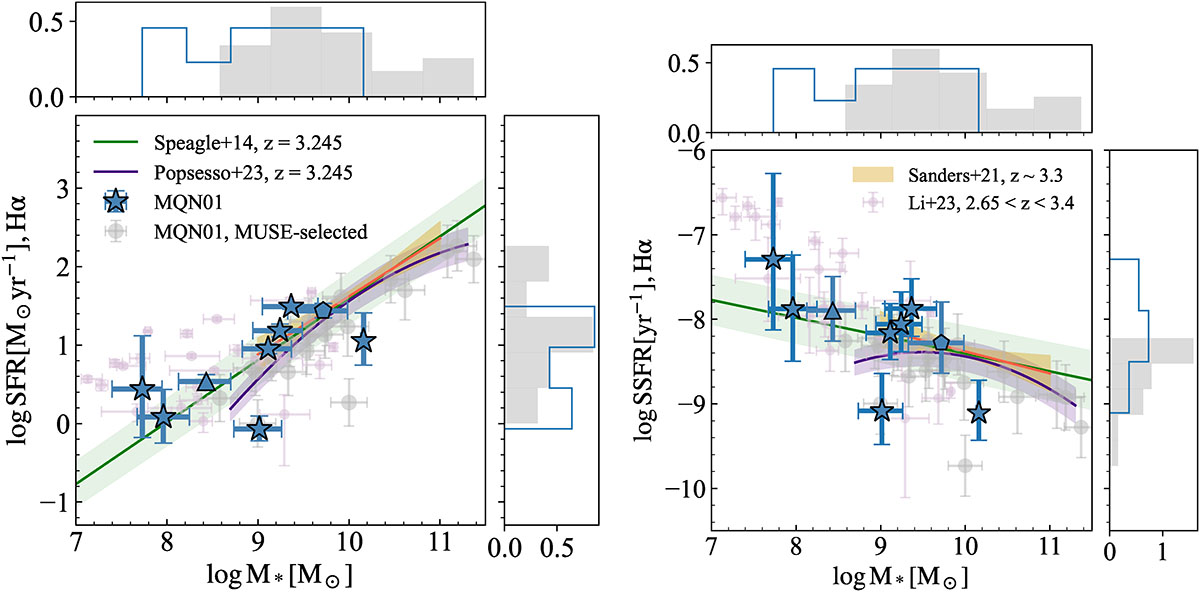
Fig. 4.
Download original image
Star formation rate and sSFR vs. stellar mass for the MQN01 sample. The SFR is calculated by Hα emission with aperture and dust correction. The galaxy sample is shown as blue stars. For the galaxy without an Hβ detection (ID: 6005), the SFR uncorrected for dust attenuation is adopted as a lower limit, shown as a blue triangle. For the galaxy without JWST photometry (ID: 3201), aperture correction calculated from HST F814W is adopted and is shown as a blue pentagon. The SFR and stellar mass derived from SED fitting for a larger sample of MQN01 galaxies (Galbiati et al. 2025) are shown as gray circles. The histograms at the top and right in both panels show the distribution of the SFR, SSFR and stellar mass for MQN01 sample in this work (blue) and that from Galbiati et al. (2025, gray). For comparison, the best-fit SFR–M* relation for the MOSDEF sample with median z ∼ 3.3 (Sanders et al. 2021) is shown as the orange line, with the shaded region indicating the 1σ uncertainty of the fitting parameters. The SFR and SSFR versus stellar mass from Li et al. (2023) are shown as purple circles. The SFR and SSFR–M* from Speagle et al. (2014) and Popesso et al. (2023) at z = 3.245 are shown as green lines and purple lines, with 1σ uncertainties of the fitting parameters shown as the shaded regions. Compared with reference SFMS, the MQN01 sample shows a median offset of ∼0.05 dex above the referred star formation main sequence (Speagle et al. 2014).
Current usage metrics show cumulative count of Article Views (full-text article views including HTML views, PDF and ePub downloads, according to the available data) and Abstracts Views on Vision4Press platform.
Data correspond to usage on the plateform after 2015. The current usage metrics is available 48-96 hours after online publication and is updated daily on week days.
Initial download of the metrics may take a while.