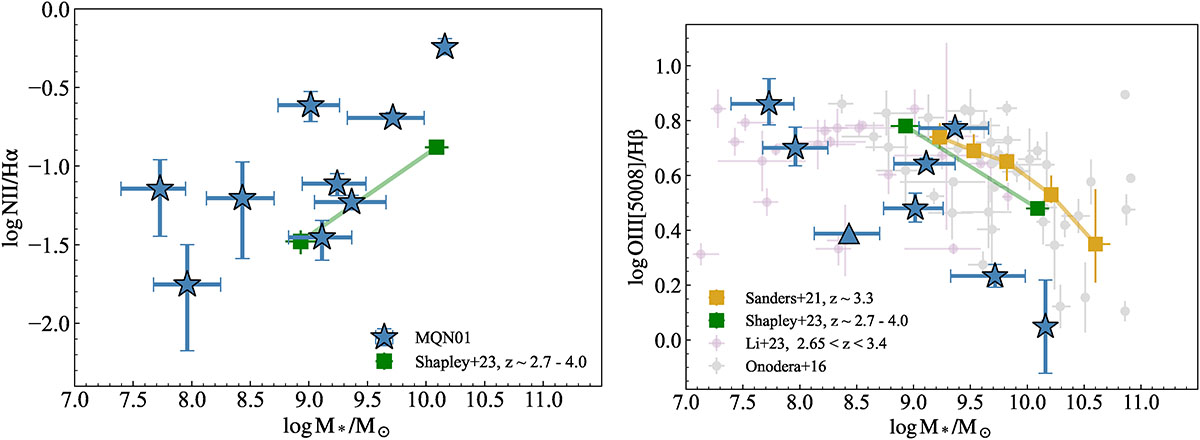
Fig. 5.
Download original image
Emission line flux ratio vs. stellar mass for the MQN01 sample. The sample is marked as blue stars. Left: log [NII]λ6585/Hα vs. stellar mass. Reference data from stacked spectra of the CEERS sample with 2.7 < z < 4.0 (Shapley et al. 2023a) are shown as green squares. Right: log [OIII]λ5008/Hβ vs. stellar mass. The galaxy without an Hβ detection is shown as a triangle at the lower limit of [OIII]λ5008/Hβ based on the 3σ detection. The datasets from Onodera et al. (2016), Sanders et al. (2021), Li et al. (2023), Shapley et al. (2023a) are included for comparison. The individual data points are shown as filled circles, with stacked values shown as squares.
Current usage metrics show cumulative count of Article Views (full-text article views including HTML views, PDF and ePub downloads, according to the available data) and Abstracts Views on Vision4Press platform.
Data correspond to usage on the plateform after 2015. The current usage metrics is available 48-96 hours after online publication and is updated daily on week days.
Initial download of the metrics may take a while.