Fig. 6.
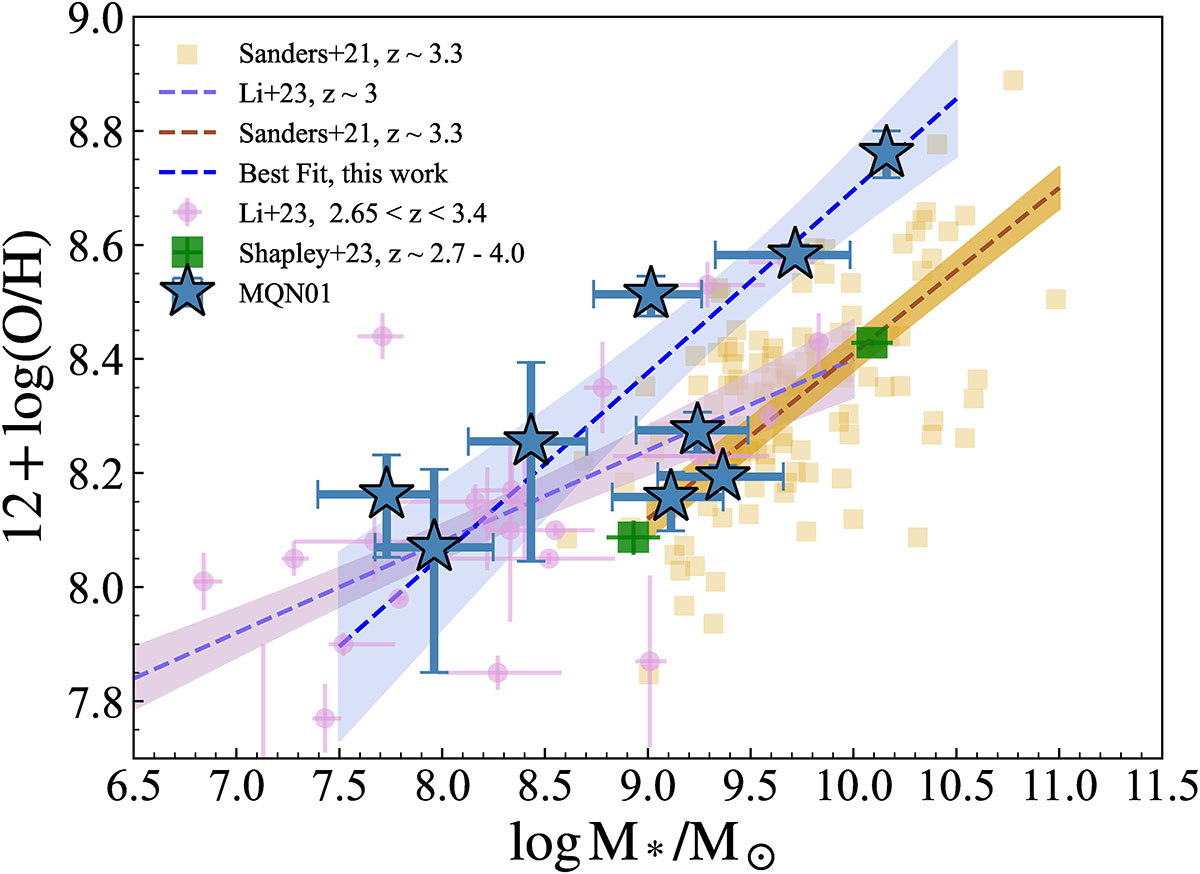
Download original image
Mass-metallicity relation for the MQN01 sample. The MQN01 galaxies are shown as blue stars. The best-fit relation with 1σ uncertainties of the total MQN01 sample is shown as a blue line and shaded region. The reference datasets at similar redshifts from Sanders et al. (2021), Li et al. (2023) are included, where the individual galaxies are shown as filled circles and squares, with the best-fit relations shown in lines and shaded regions representing 1σ uncertainties. The individual data points of the sample in Sanders et al. (2021) were extracted using WebPlotDigitizer. The CEERS sample (Shapley et al. 2023a) is shown as green squares, with metallicities calculated using N2, O3, and O3N2 with Bian et al. (2018) calibrations.
Current usage metrics show cumulative count of Article Views (full-text article views including HTML views, PDF and ePub downloads, according to the available data) and Abstracts Views on Vision4Press platform.
Data correspond to usage on the plateform after 2015. The current usage metrics is available 48-96 hours after online publication and is updated daily on week days.
Initial download of the metrics may take a while.