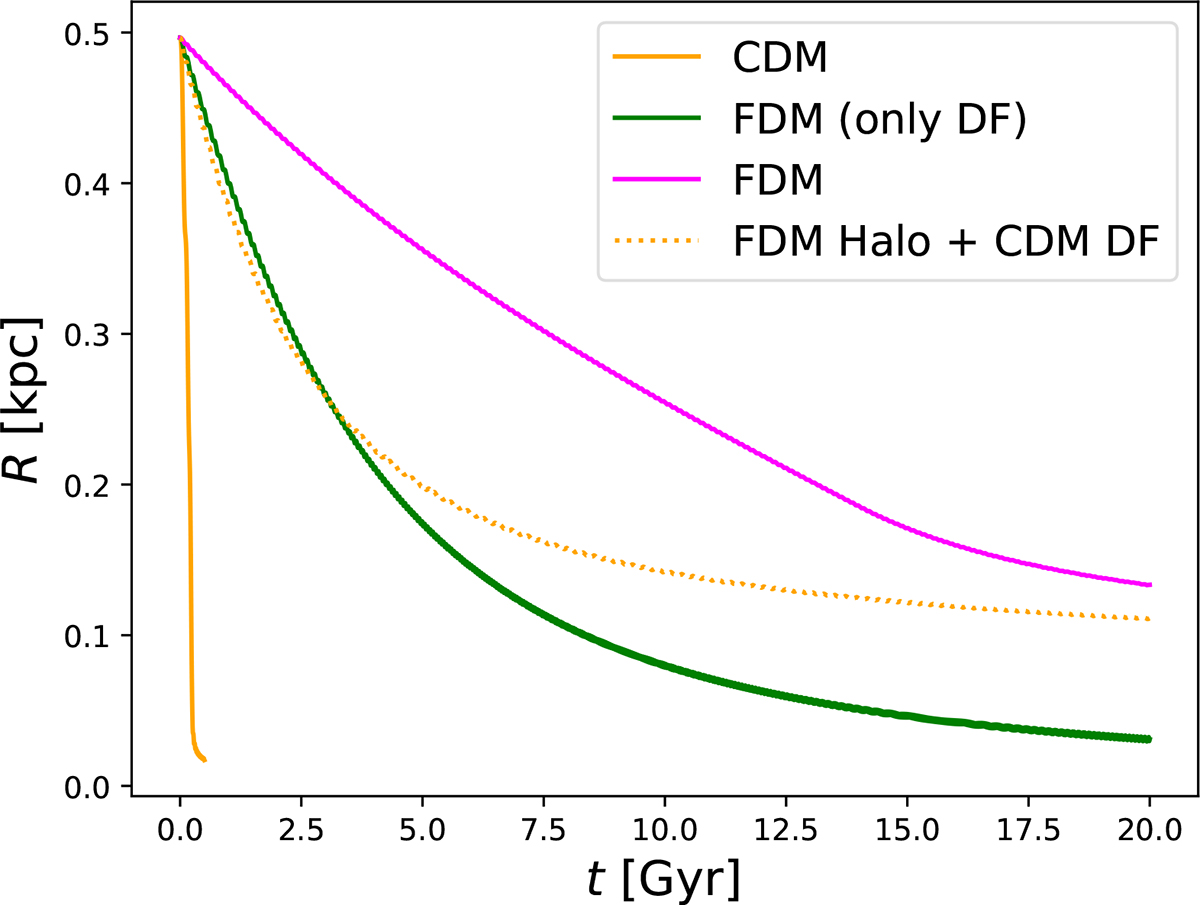
Fig. 3.
Download original image
Stalling of Fornax GC3: Orbital radius of GC3 (third row of Table 1) as a function of time, starting from its currently observed projected radius, assuming a circular orbit as the initial condition. Orange curves show orbital integrations using the classical Chandrasekhar DF formula, while green and magenta curves use the FDM DF model developed in this work. Solid orange and green lines correspond to orbits integrated in a cuspy NFW halo, while dashed orange and solid magenta lines represent orbits in a large-core halo model from Cole et al. (2012).
Current usage metrics show cumulative count of Article Views (full-text article views including HTML views, PDF and ePub downloads, according to the available data) and Abstracts Views on Vision4Press platform.
Data correspond to usage on the plateform after 2015. The current usage metrics is available 48-96 hours after online publication and is updated daily on week days.
Initial download of the metrics may take a while.