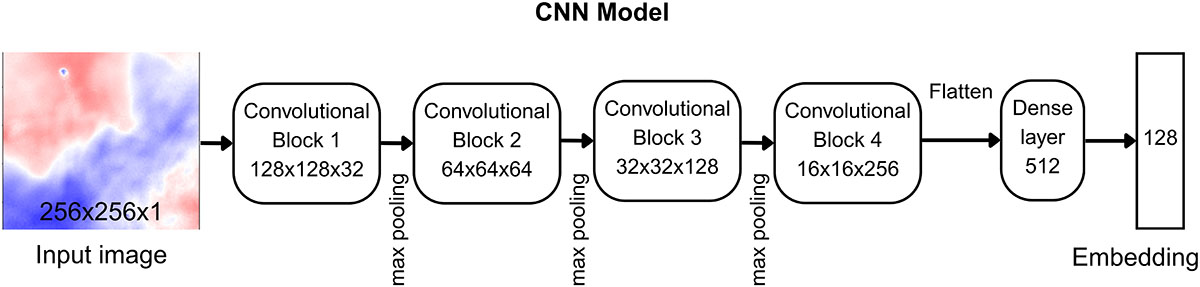
Fig. 1.
Download original image
Diagram of the CNN architecture used in our analysis. The network processes 128 × 128 × 1 input velocity maps through a series of convolution and max-pooling layers to extract hierarchical features. The resulting feature map is flattened and passed through a fully connected dense layer of 512 units, culminating in a 128D embedding vector that provides a compact, discriminative representation of the cluster kinematics.
Current usage metrics show cumulative count of Article Views (full-text article views including HTML views, PDF and ePub downloads, according to the available data) and Abstracts Views on Vision4Press platform.
Data correspond to usage on the plateform after 2015. The current usage metrics is available 48-96 hours after online publication and is updated daily on week days.
Initial download of the metrics may take a while.