Open Access
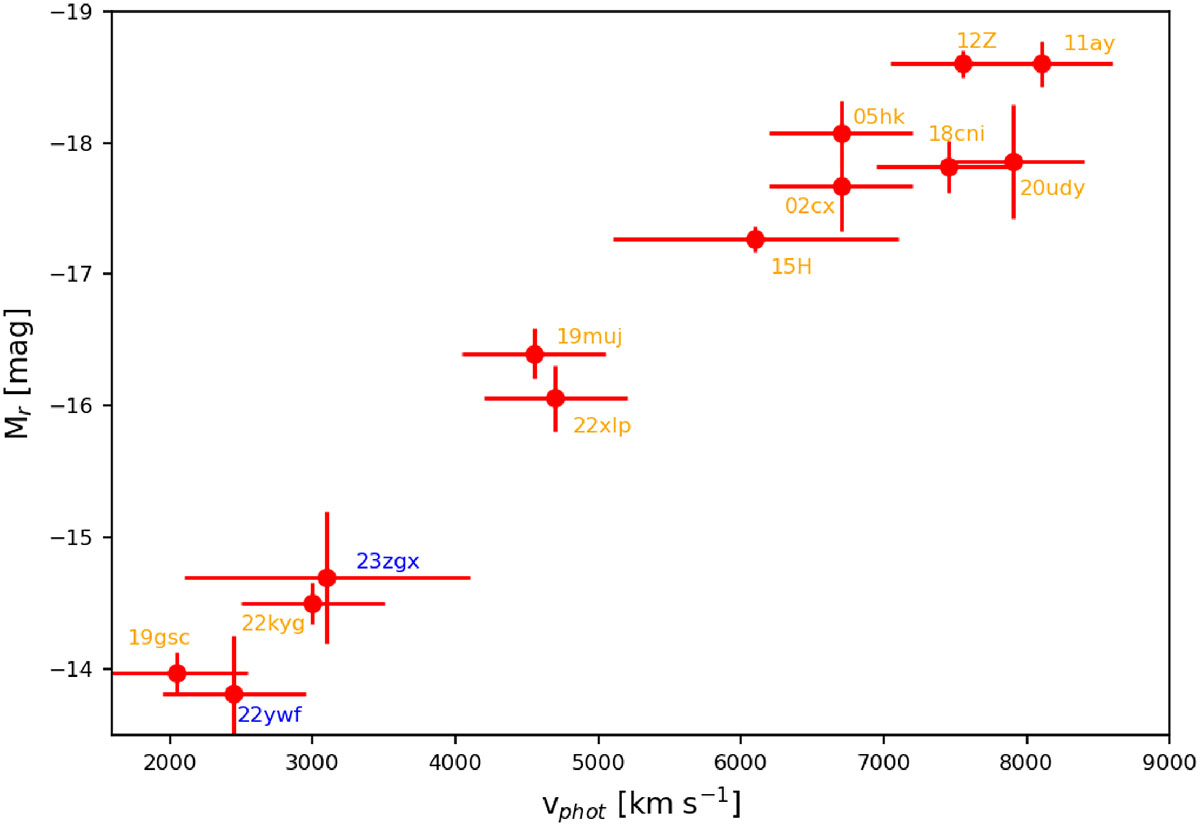
Fig. 11.
Download original image
Absolute r/R-band magnitudes of SNe Iax versus photospheric velocity at maximum light. Only SNe Iax with abundance tomography are plotted. In case of no spectral coverage of the maximum (SNe 2015H and 2023zgx), we estimated photospheric velocity via linear extrapolation. Table A.7 lists the corresponding references.
Current usage metrics show cumulative count of Article Views (full-text article views including HTML views, PDF and ePub downloads, according to the available data) and Abstracts Views on Vision4Press platform.
Data correspond to usage on the plateform after 2015. The current usage metrics is available 48-96 hours after online publication and is updated daily on week days.
Initial download of the metrics may take a while.