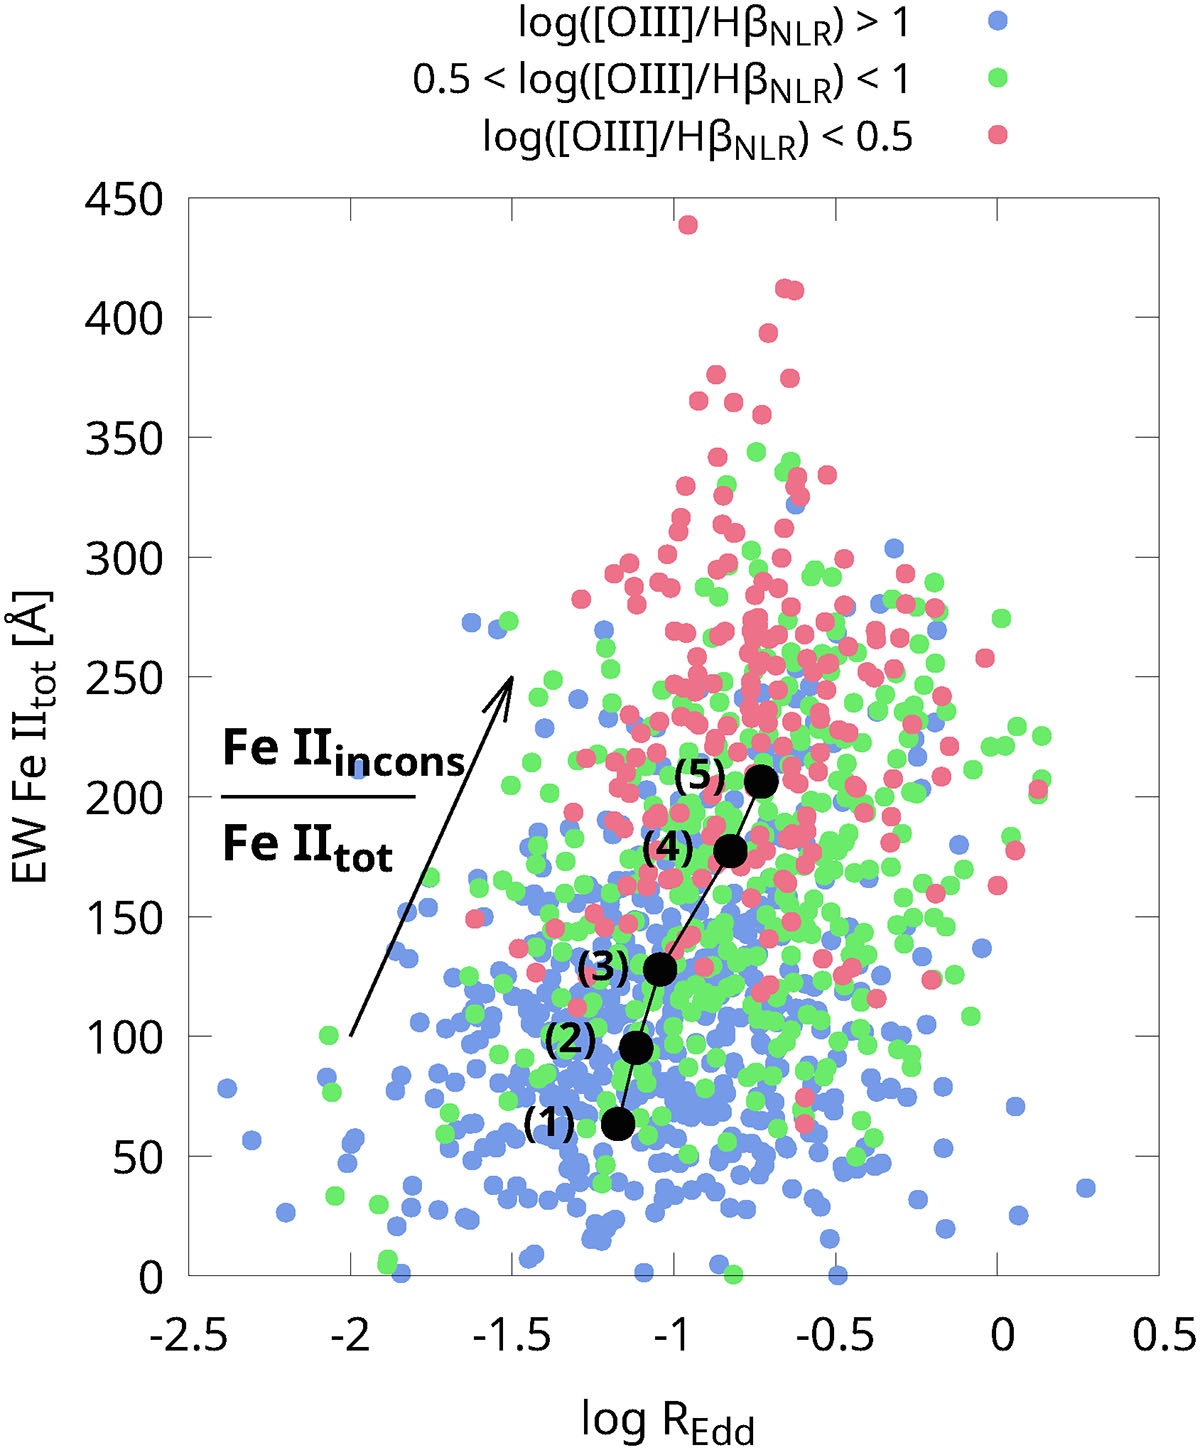
Fig. 12.
Download original image
Growth of the contribution of Fe IIincons in total Fe II, with the increase of the REdd and decrease of the [O III]/HβNLR. The sample is divided into five subsets according to the Fe IIincons/Fe IItot ratio: (1) Fe IIincons/Fe IItot < 0.1 (87 objects), (2) 0.1 < Fe IIincons/Fe IItot < 0.2 (134 objects), (3) 0.2 < Fe IIincons/Fe IItot < 0.3 (187 objects), (4) 0.3 < Fe IIincons/Fe IItot < 0.4 (320 objects), and (5) Fe IIincons/Fe IItot > 0.4 (293 objects). For each subset, we found the mean of EW Fe IItot and REdd, which are plotted with black dots and indicated by the corresponding numbers (1–5). Additionally, the points are coloured according to log([O III]/HβNLR) strength.
Current usage metrics show cumulative count of Article Views (full-text article views including HTML views, PDF and ePub downloads, according to the available data) and Abstracts Views on Vision4Press platform.
Data correspond to usage on the plateform after 2015. The current usage metrics is available 48-96 hours after online publication and is updated daily on week days.
Initial download of the metrics may take a while.