Open Access
Fig. 4.
Download original image
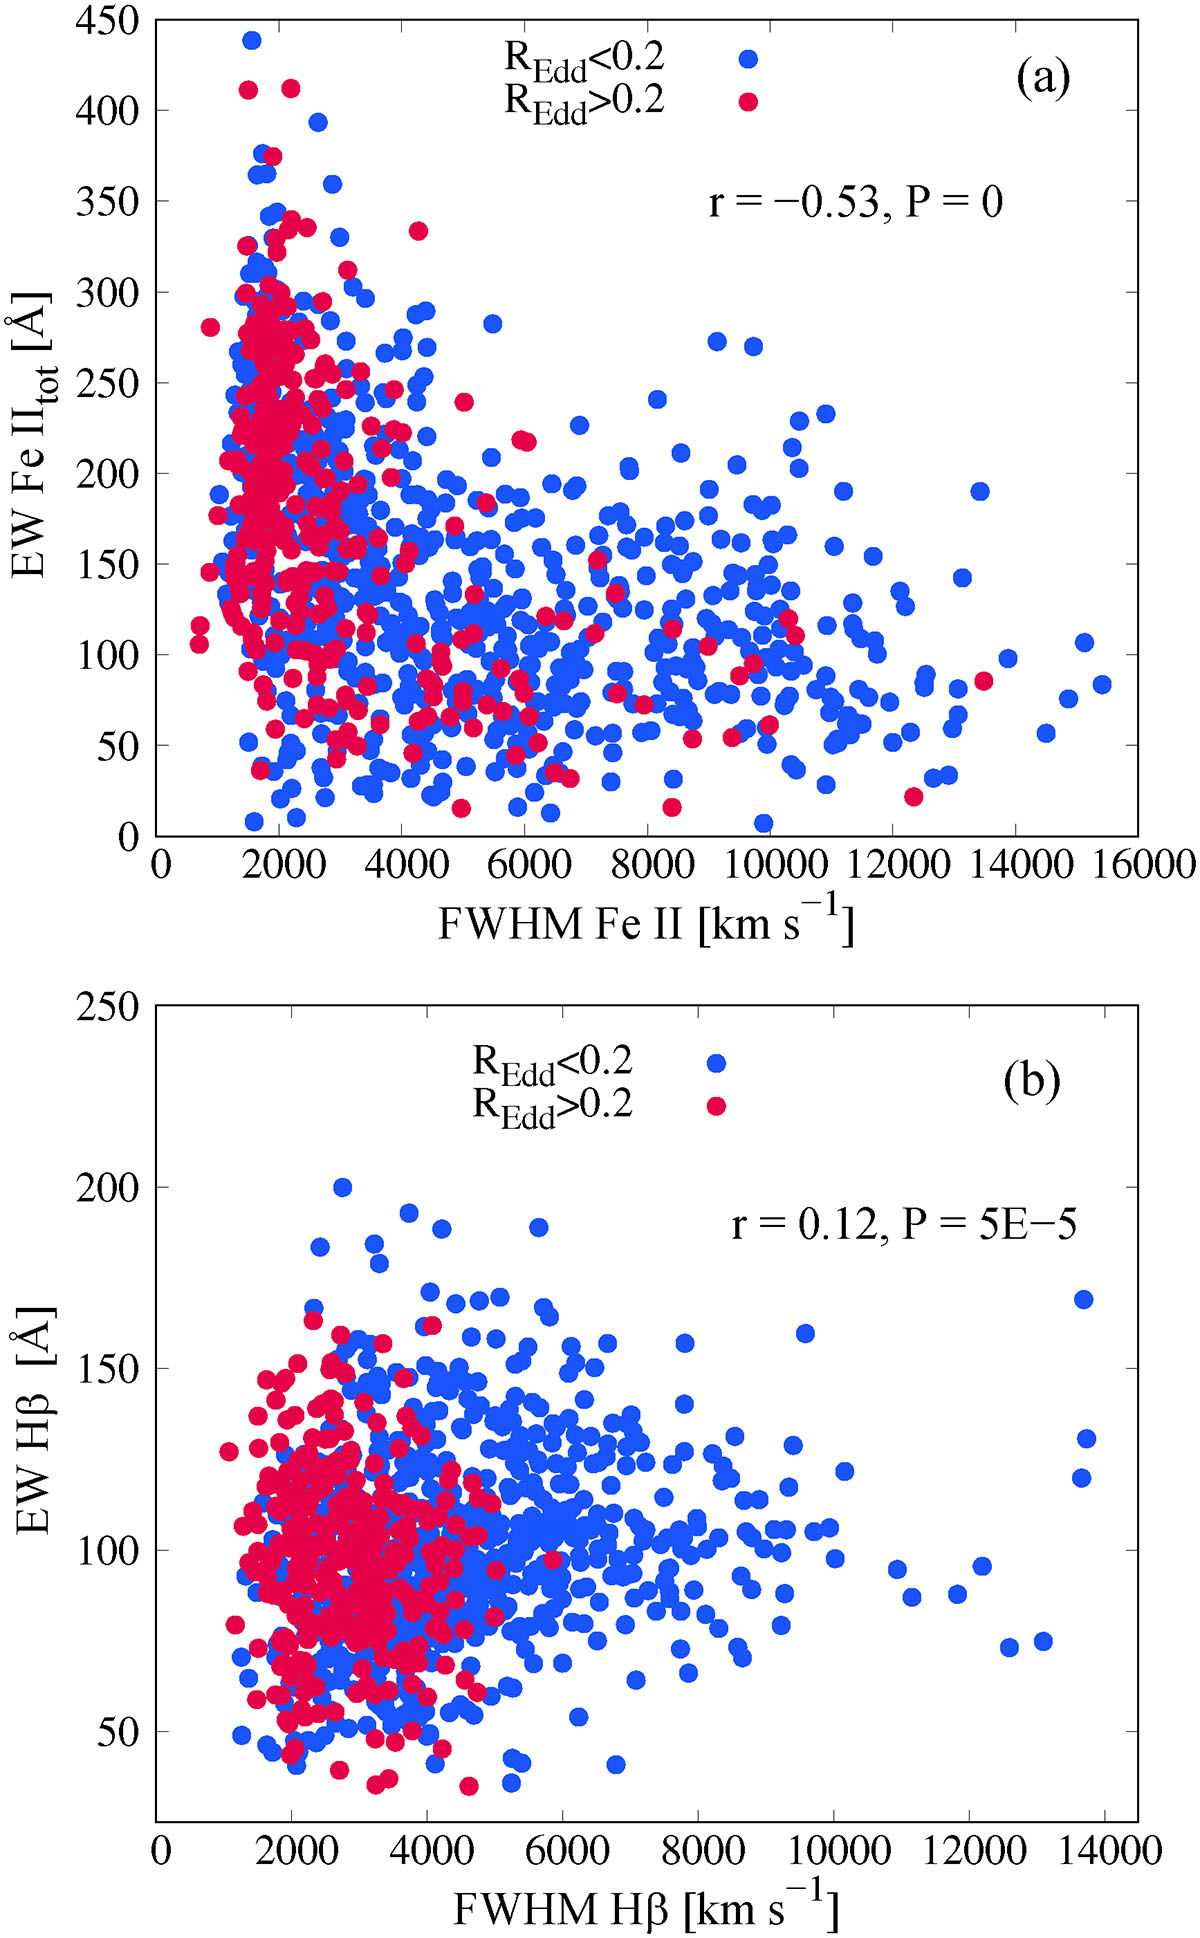
Relationship between EW Fe IItot and FWHM Fe II (a) and the same but for the EW Hβ and FWHM Hβ (b). The blue points denote objects with an Eddington ratio lower than 0.2, while red points indicate sources with an Eddington ratio larger than 0.2. The Spearman coefficients of correlations (r) and P-values are given in graphs.
Current usage metrics show cumulative count of Article Views (full-text article views including HTML views, PDF and ePub downloads, according to the available data) and Abstracts Views on Vision4Press platform.
Data correspond to usage on the plateform after 2015. The current usage metrics is available 48-96 hours after online publication and is updated daily on week days.
Initial download of the metrics may take a while.