Open Access
Fig. 5.
Download original image
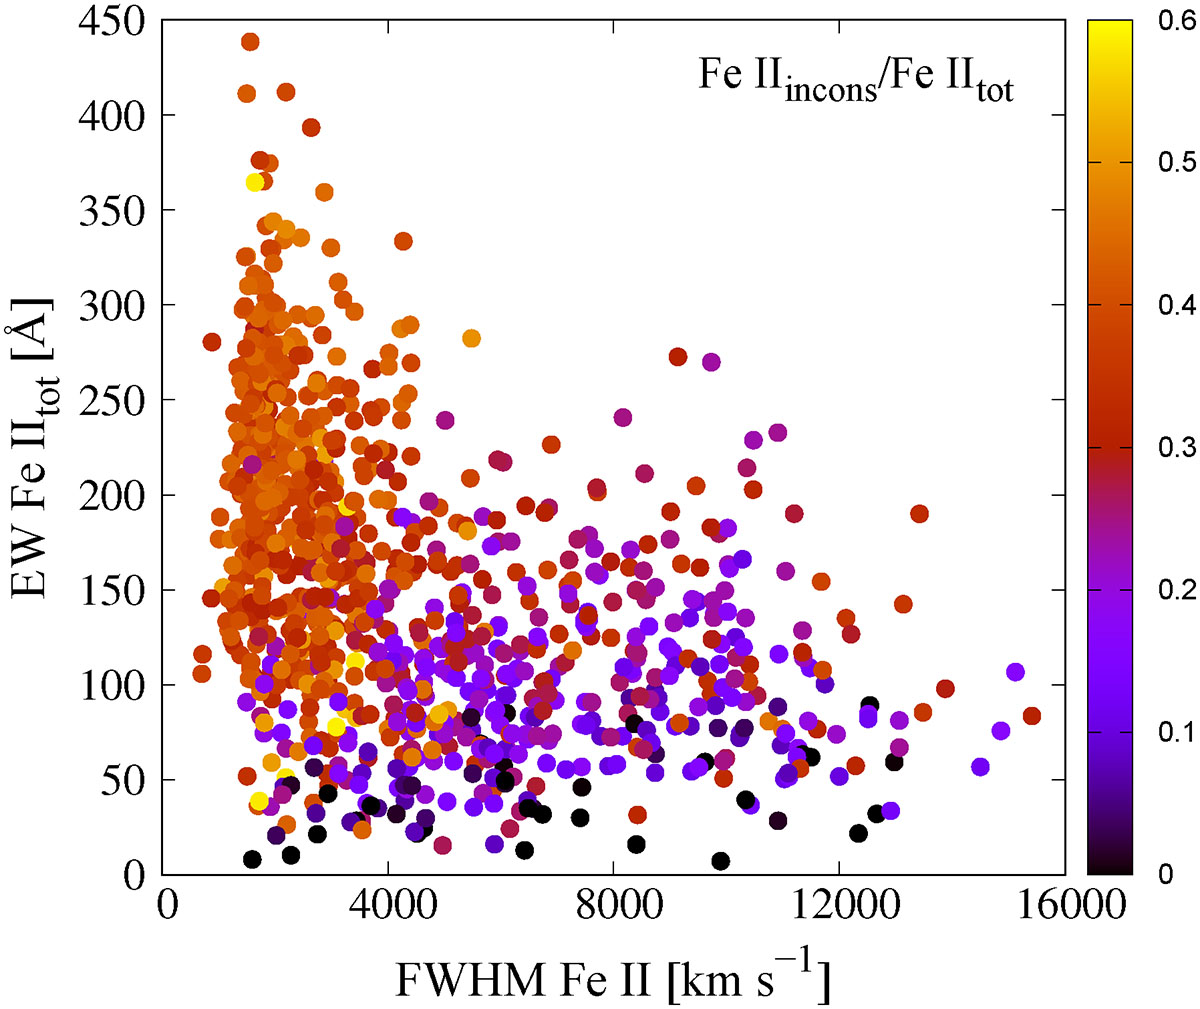
Contribution of the Fe IIincons lines to the total Fe II flux in the 4000–5600 Å range. Colours indicate the variation of the Fe IIincons/Fe IItot ratio across the EW Fe IItot–FWHM Fe II parameter space.
Current usage metrics show cumulative count of Article Views (full-text article views including HTML views, PDF and ePub downloads, according to the available data) and Abstracts Views on Vision4Press platform.
Data correspond to usage on the plateform after 2015. The current usage metrics is available 48-96 hours after online publication and is updated daily on week days.
Initial download of the metrics may take a while.