Open Access
Fig. 6.
Download original image
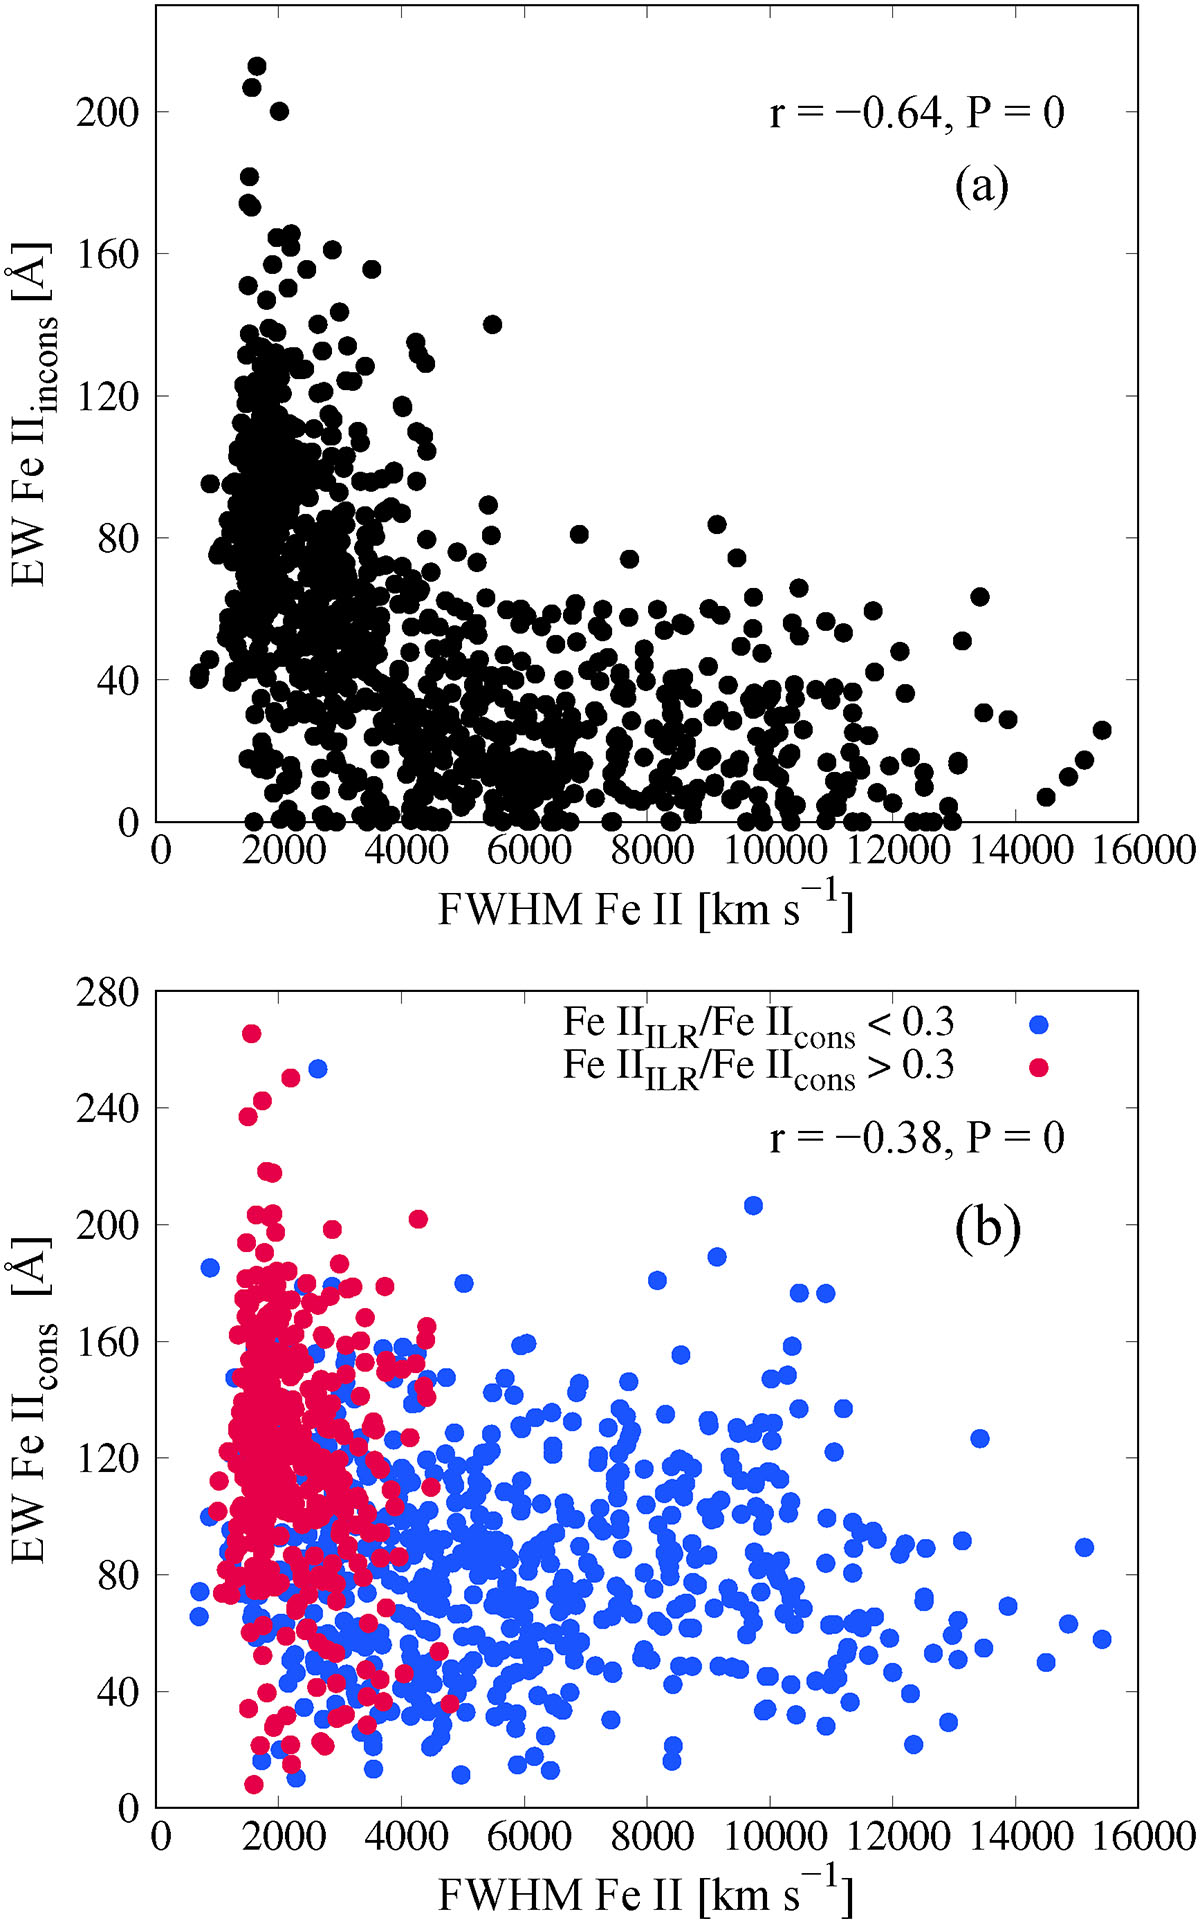
Correlation between the FWHM of Fe II and the EW of Fe IIincons (a) and the EW of Fe IIcons (b). In panel (b), blue points denote objects in which the ILR component contributes less than 30% of the Fe IIcons flux, while red points mark sources with an ILR contribution exceeding 30% of the Fe IIcons flux.
Current usage metrics show cumulative count of Article Views (full-text article views including HTML views, PDF and ePub downloads, according to the available data) and Abstracts Views on Vision4Press platform.
Data correspond to usage on the plateform after 2015. The current usage metrics is available 48-96 hours after online publication and is updated daily on week days.
Initial download of the metrics may take a while.