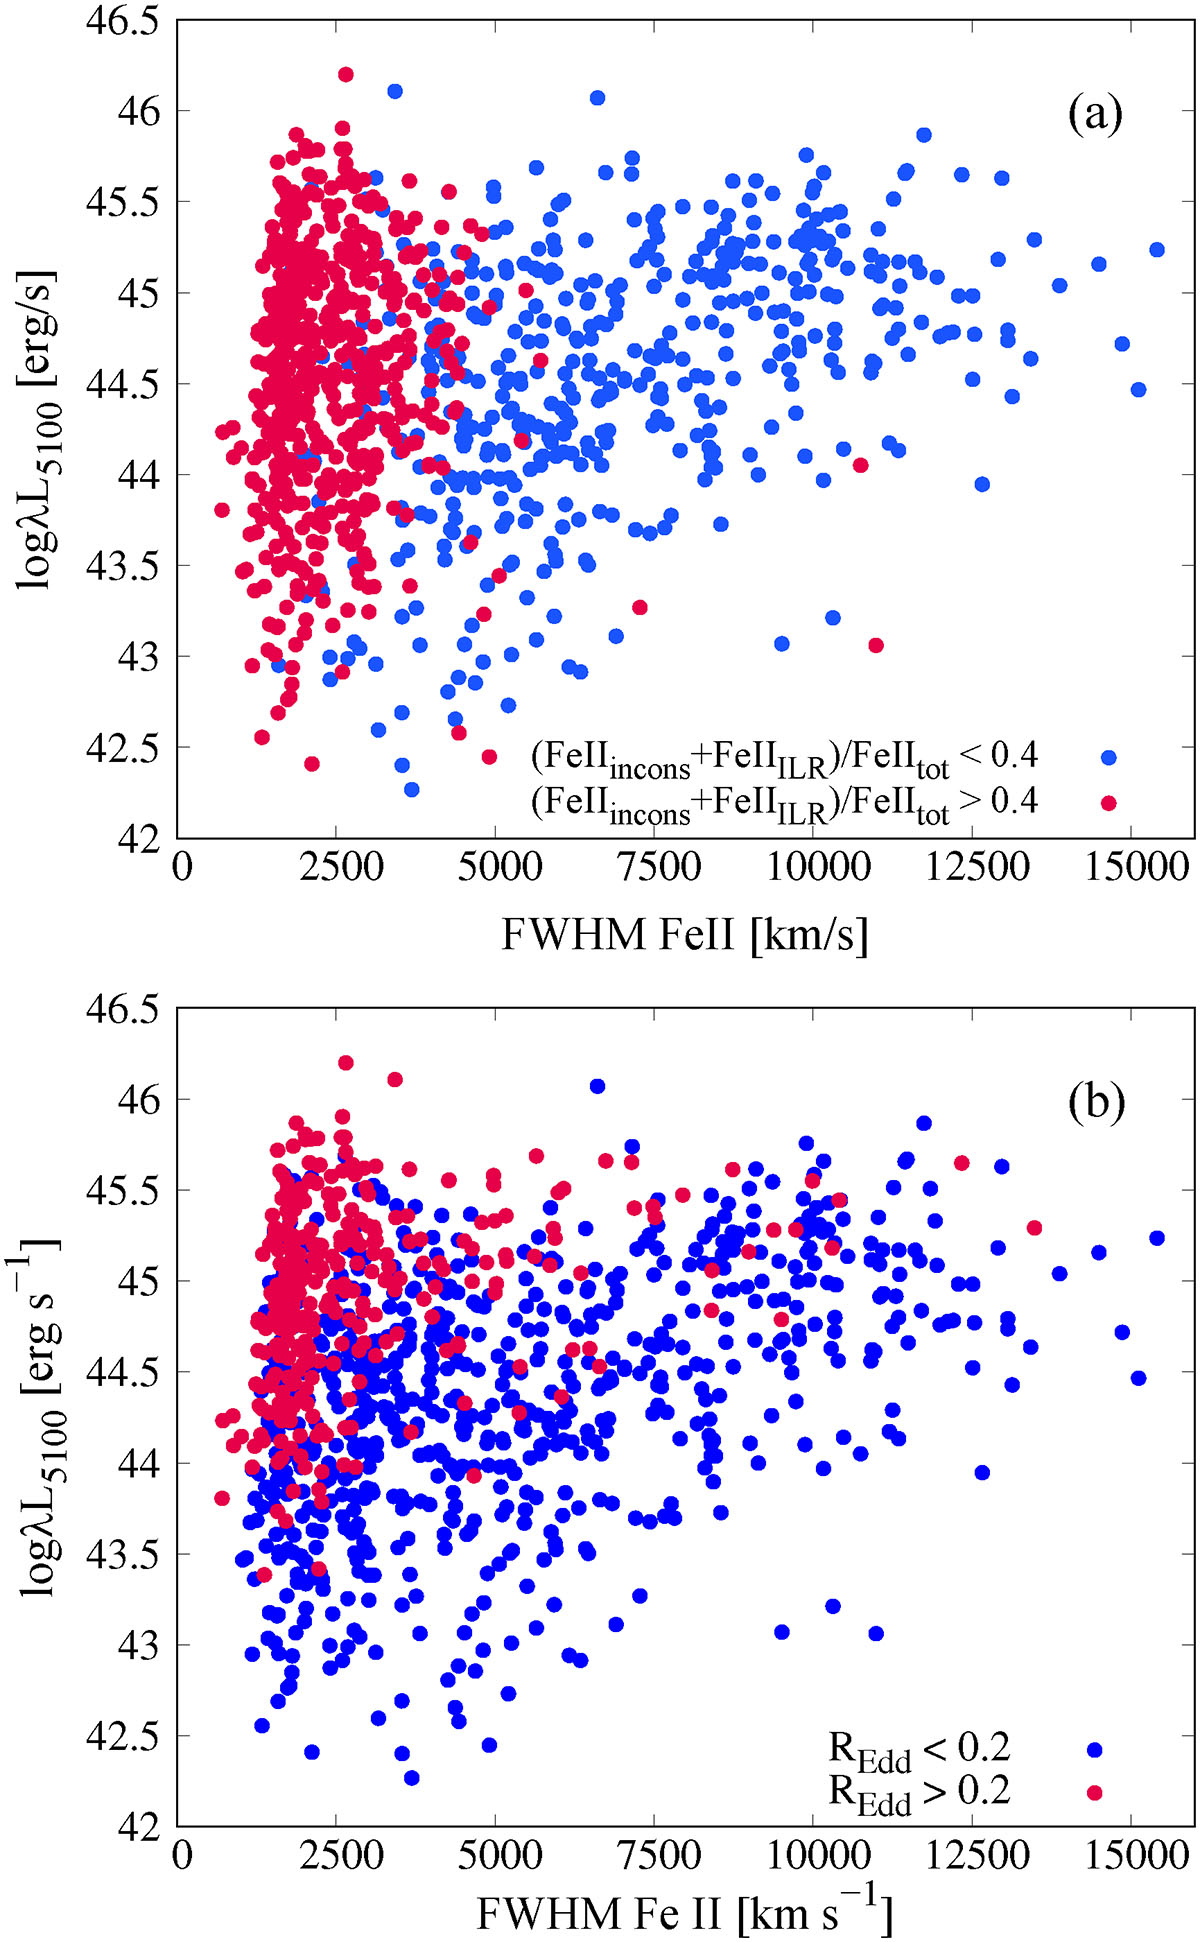
Fig. 8.
Download original image
Relationship between log λL5100 and the width of the Fe II lines. In panel (a), red points mark objects in which the combined contribution of Fe IIincons and Fe IIILR exceeds 40 % of the total Fe II flux, whereas blue points denote sources in which this contribution falls below the same threshold. The distribution of objects with REdd smaller and larger than 0.2 is shown in panel (b).
Current usage metrics show cumulative count of Article Views (full-text article views including HTML views, PDF and ePub downloads, according to the available data) and Abstracts Views on Vision4Press platform.
Data correspond to usage on the plateform after 2015. The current usage metrics is available 48-96 hours after online publication and is updated daily on week days.
Initial download of the metrics may take a while.