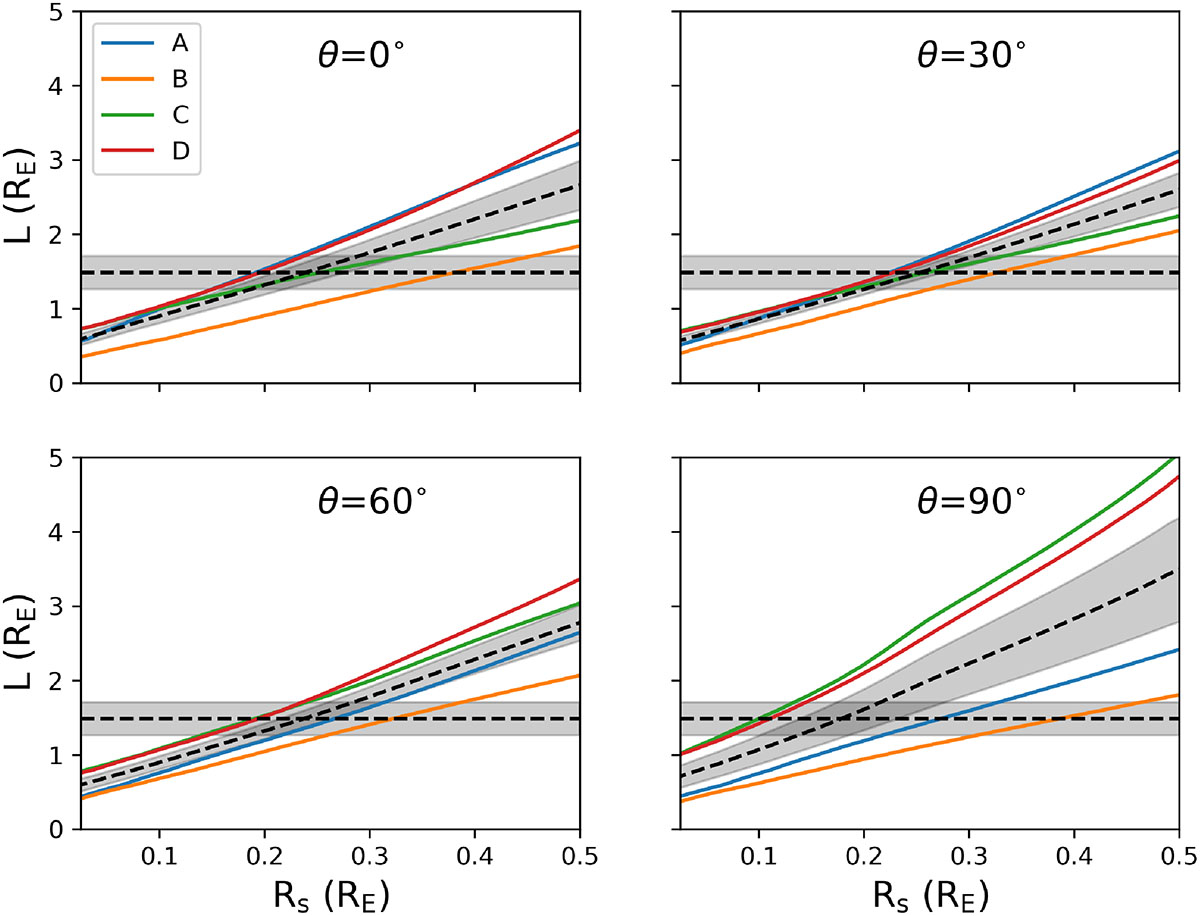
Fig. 10.
Download original image
Rs − L curves consistent with the standard deviations of the observed g-band DLCs. We consider four trajectory angles measured east of north (θ = 0, 30, 60, and 90°). The inclined dashed black lines and the grey regions around them describe the average Rs − L curves and their standard error bands, while the horizontal dashed black line and the horizontal grey strip represent an estimate of the trajectory length.
Current usage metrics show cumulative count of Article Views (full-text article views including HTML views, PDF and ePub downloads, according to the available data) and Abstracts Views on Vision4Press platform.
Data correspond to usage on the plateform after 2015. The current usage metrics is available 48-96 hours after online publication and is updated daily on week days.
Initial download of the metrics may take a while.