Fig. 1
Download original image
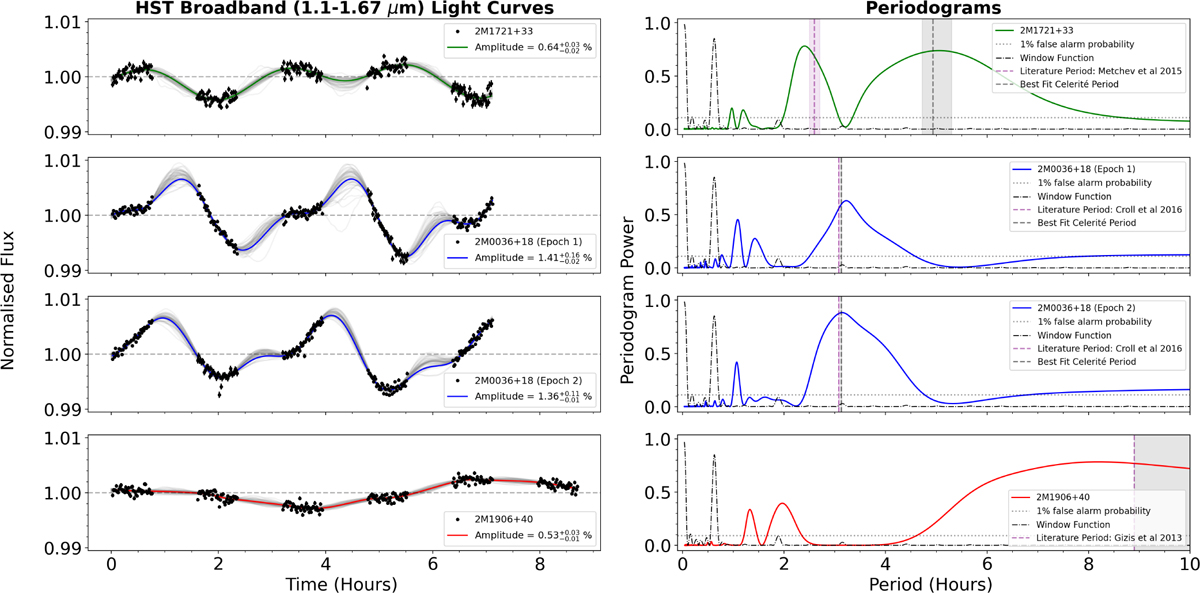
Left : broadband G141 filter light curves of each of our observations. A sample of 100 posterior fits of each light curve are shown in grey, while the best-fit light curve is shown in colour for each observation. All four light curves are variable. Right : periodogram for each light curve. The periodogram for the window function of HST is shown by the dash-dotted black line in each plot. The period of each object from the literature is shown by the purple vertical line in the periodogram, while the period output from our celerité2 models are shown by the black vertical lines. The uncertainties for the period values from the literature and from this work are represented by the shaded regions in purple and black, respectively. Our model periods agree with the literature for each observation except 2M1721+33, where we estimate a longer period of ![]() hours.
hours.
Current usage metrics show cumulative count of Article Views (full-text article views including HTML views, PDF and ePub downloads, according to the available data) and Abstracts Views on Vision4Press platform.
Data correspond to usage on the plateform after 2015. The current usage metrics is available 48-96 hours after online publication and is updated daily on week days.
Initial download of the metrics may take a while.