Fig. 3
Download original image
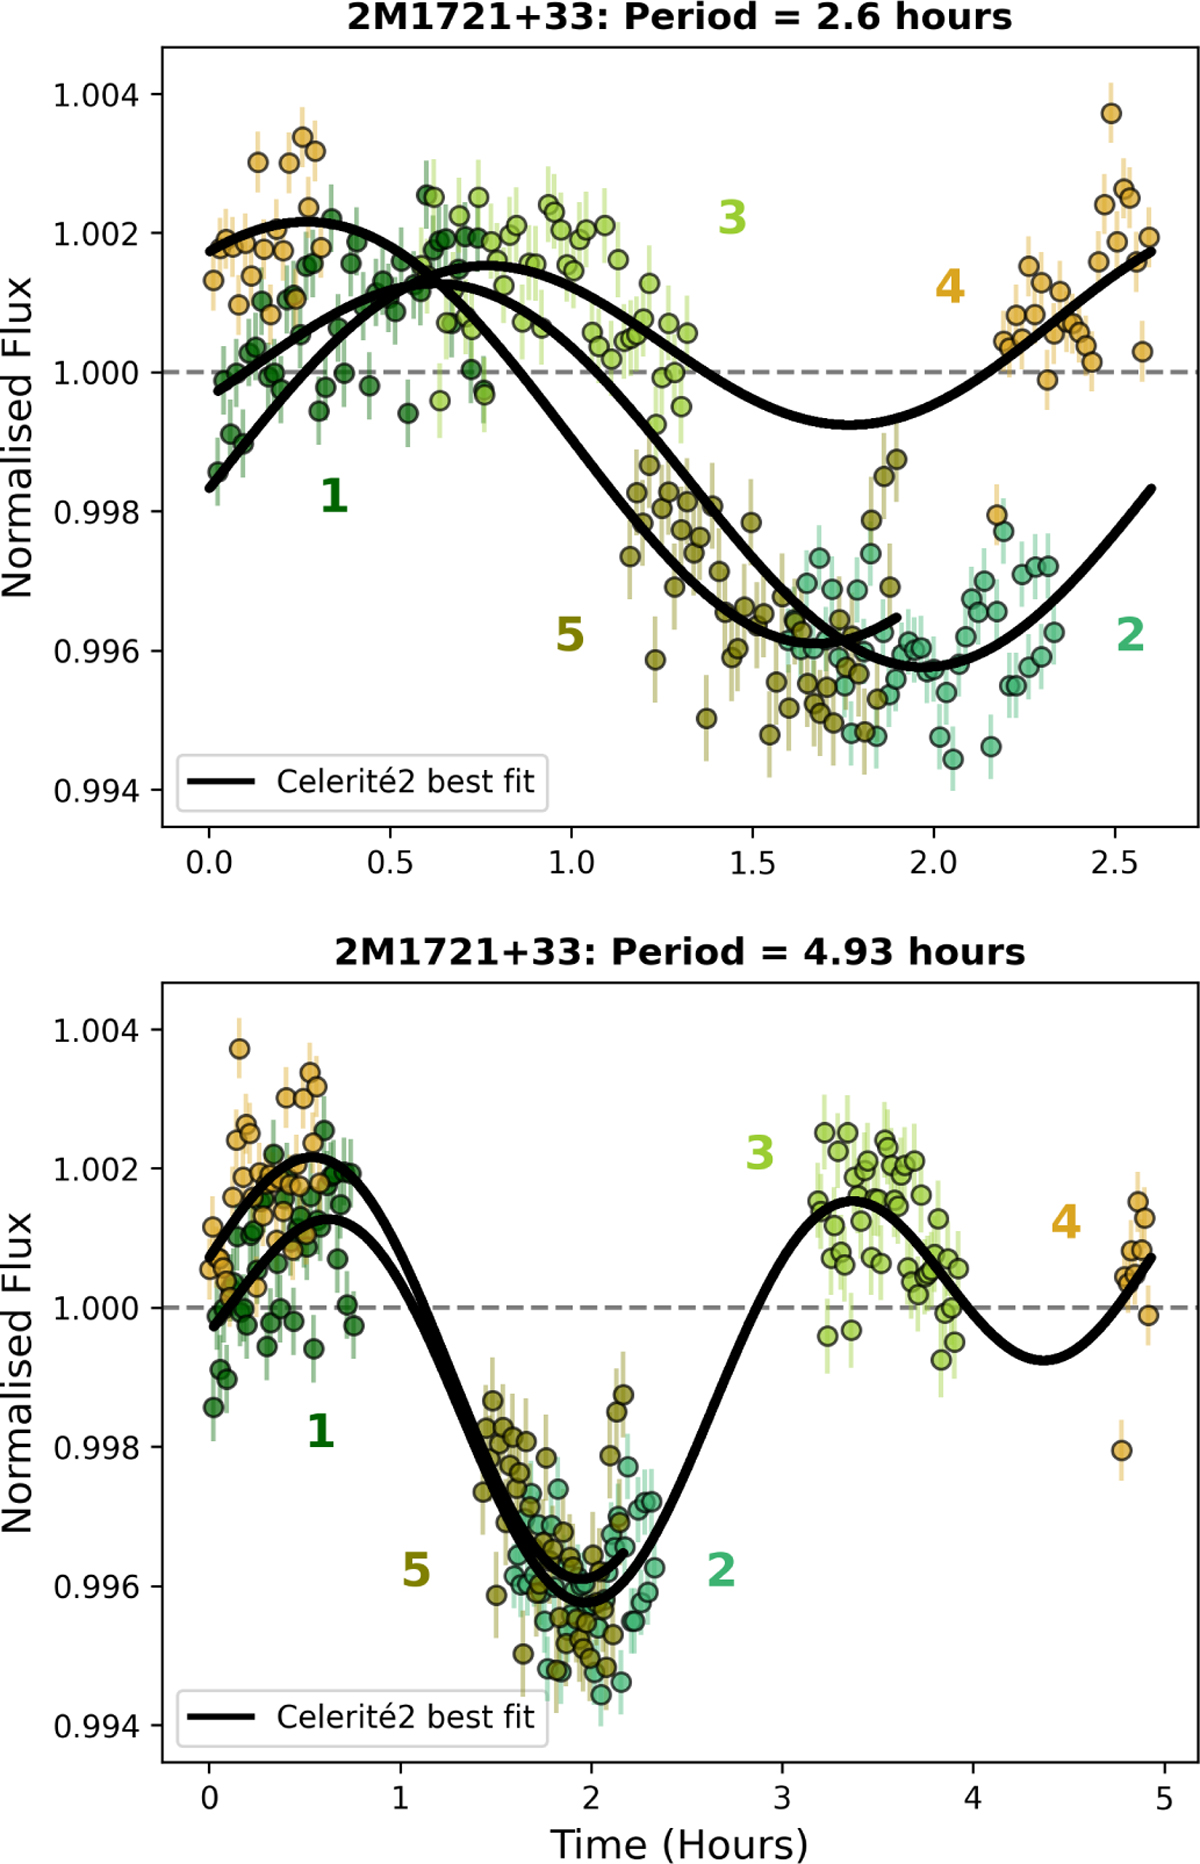
Top : phase-folded white light curve of 2M1721+33 using the 2.6±0.1 hour period reported by Metchev et al. (2015). The photometric points from each HST orbit are colour-coded and the best-fit celerité2 model is plotted in black. Using this period for phasefolding does not give a clean light curve. Bottom : phase-folded white light curve according to the period of ![]() hours from this work. While this observation does not cover more than 1.5 rotations, the phase-folded regions (orbits 1 and 4, and orbits 2 and 5) overlap with each other in both the HST data and the celerité2 model. This cleaner phase-folded light curve, along with Figure 2 motivated us to adopt this new period for 2M1721+33.
hours from this work. While this observation does not cover more than 1.5 rotations, the phase-folded regions (orbits 1 and 4, and orbits 2 and 5) overlap with each other in both the HST data and the celerité2 model. This cleaner phase-folded light curve, along with Figure 2 motivated us to adopt this new period for 2M1721+33.
Current usage metrics show cumulative count of Article Views (full-text article views including HTML views, PDF and ePub downloads, according to the available data) and Abstracts Views on Vision4Press platform.
Data correspond to usage on the plateform after 2015. The current usage metrics is available 48-96 hours after online publication and is updated daily on week days.
Initial download of the metrics may take a while.