Fig. 8
Download original image
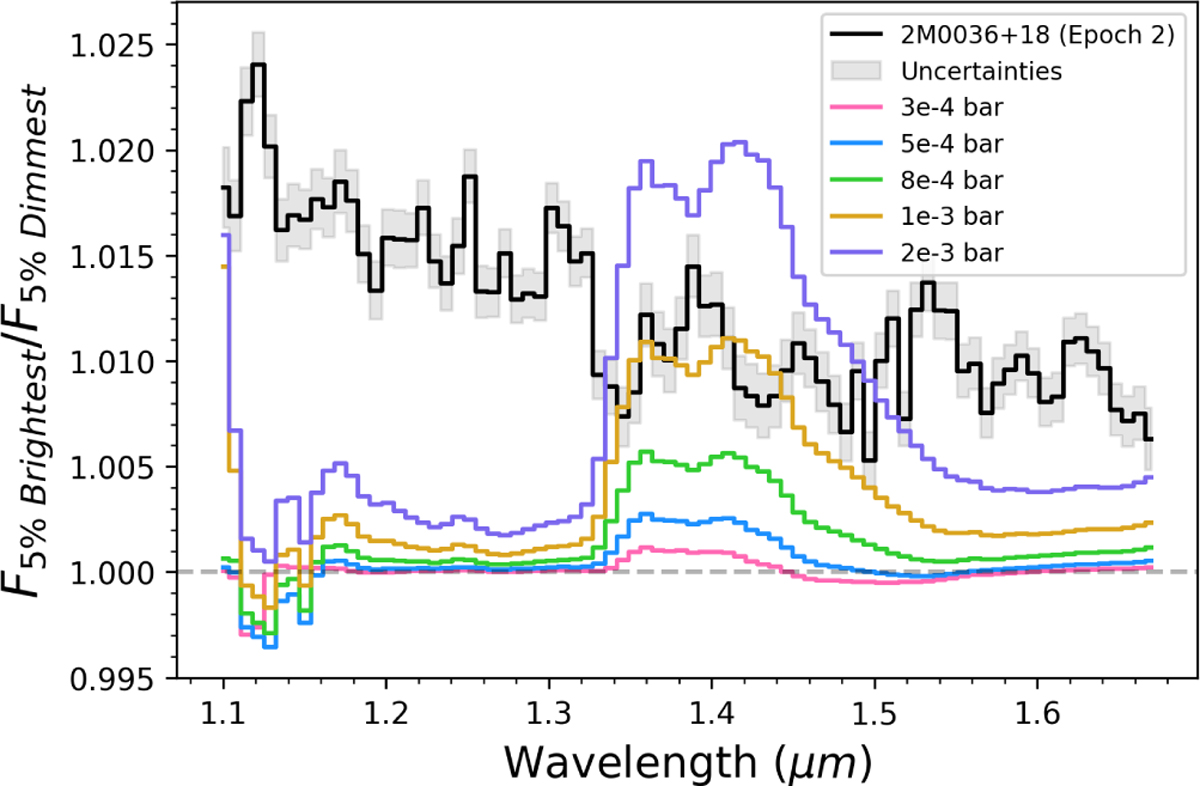
Spectral variability amplitude of 2M0036+18 (epoch 2) (black line with uncertainties in grey) with the aurora modelled by the temperature inversion method. This model is for a 350K temperature inversion at different peak pressures, with a width of 1 pressure scale height (100.1 mbar) and a ΔA = 0.1. The models are shown by the coloured lines. As the peak pressure of the inversion is placed at higher pressures, lower in the atmosphere, the predicted variability amplitude in the water band increases. However, there is very little variability outside the water band, no matter the temperature inversion or peak pressure value.
Current usage metrics show cumulative count of Article Views (full-text article views including HTML views, PDF and ePub downloads, according to the available data) and Abstracts Views on Vision4Press platform.
Data correspond to usage on the plateform after 2015. The current usage metrics is available 48-96 hours after online publication and is updated daily on week days.
Initial download of the metrics may take a while.