Open Access
Fig. A.2
Download original image
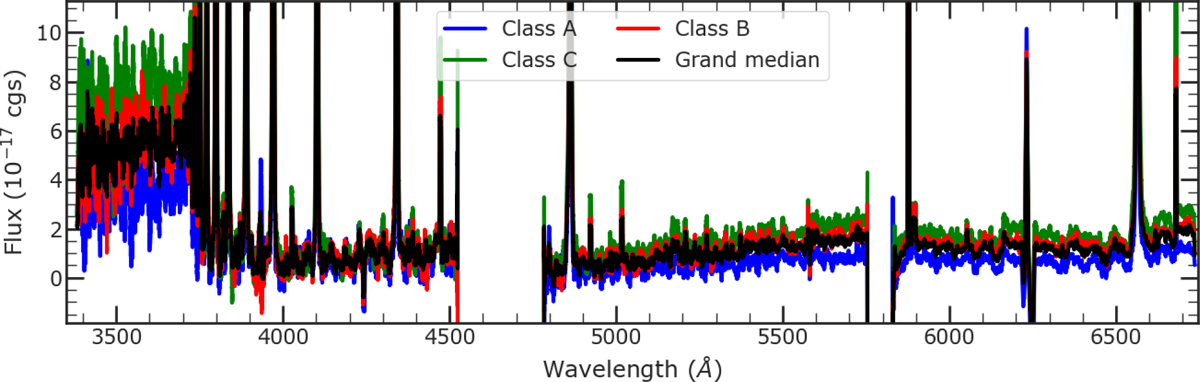
UVES spectrum of Delorme 1 (AB)b over the whole wavelength range, smoothened with a box size of 500 pixels. The rise in the UV excess and continuum level beyond ∼5300 A can be clearly seen in the class C median compared to class A and class B. ‘cgs’ denotes erg s−1 cm−2 A−1.
Current usage metrics show cumulative count of Article Views (full-text article views including HTML views, PDF and ePub downloads, according to the available data) and Abstracts Views on Vision4Press platform.
Data correspond to usage on the plateform after 2015. The current usage metrics is available 48-96 hours after online publication and is updated daily on week days.
Initial download of the metrics may take a while.