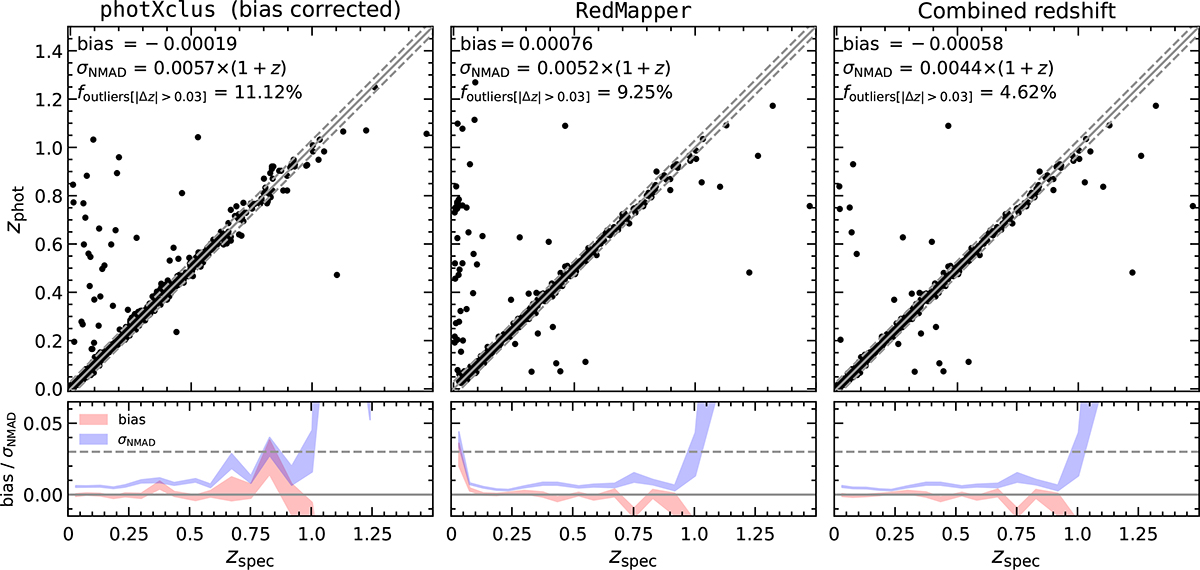
Fig. 1.
Download original image
Performances of the photometric redshift estimates. Top: Photometric redshifts vs. spectroscopic redshifts for confirmed X-CLASS clusters. Bottom: Bias (red) and NMAD scatter (blue) of the photometric redshift estimates as a function of spectroscopic redshifts for confirmed X-CLASS clusters. From left to right: (i) bias-corrected photXclus redshift, (ii) redMaPPer redshift, and (iii) best photometric redshift estimate. The quantities σNMAD, bias (defined as the median of Δz = zphot − zspec), and the outlier fraction are defined in the main text.
Current usage metrics show cumulative count of Article Views (full-text article views including HTML views, PDF and ePub downloads, according to the available data) and Abstracts Views on Vision4Press platform.
Data correspond to usage on the plateform after 2015. The current usage metrics is available 48-96 hours after online publication and is updated daily on week days.
Initial download of the metrics may take a while.