Open Access
Fig. 4.
Download original image
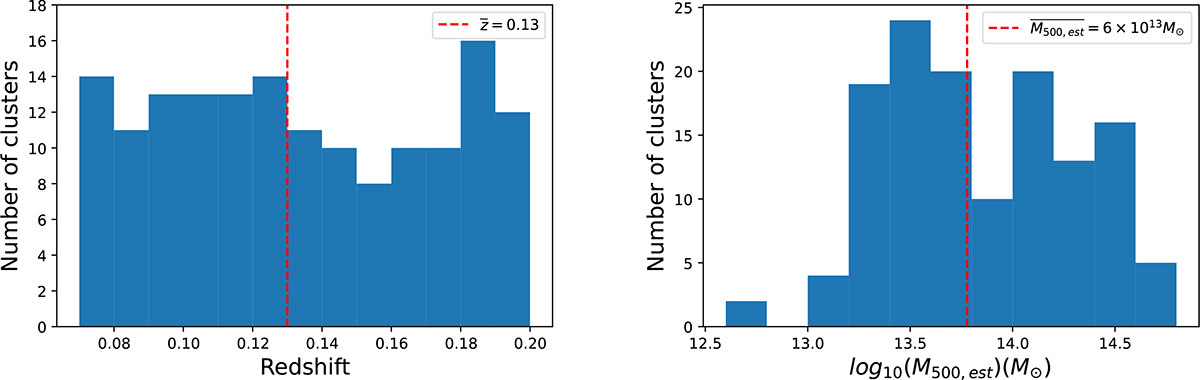
Left: Redshift distribution of the X-CLASS-LR sample composed of 155 groups and clusters of galaxies. The dashed line indicates the median redshift. Right: Estimated mass distribution of the X-CLASS-LR sample. The dashed lines indicate the median redshift and the median mass (logarithmic scale).
Current usage metrics show cumulative count of Article Views (full-text article views including HTML views, PDF and ePub downloads, according to the available data) and Abstracts Views on Vision4Press platform.
Data correspond to usage on the plateform after 2015. The current usage metrics is available 48-96 hours after online publication and is updated daily on week days.
Initial download of the metrics may take a while.