Fig. 4
Download original image
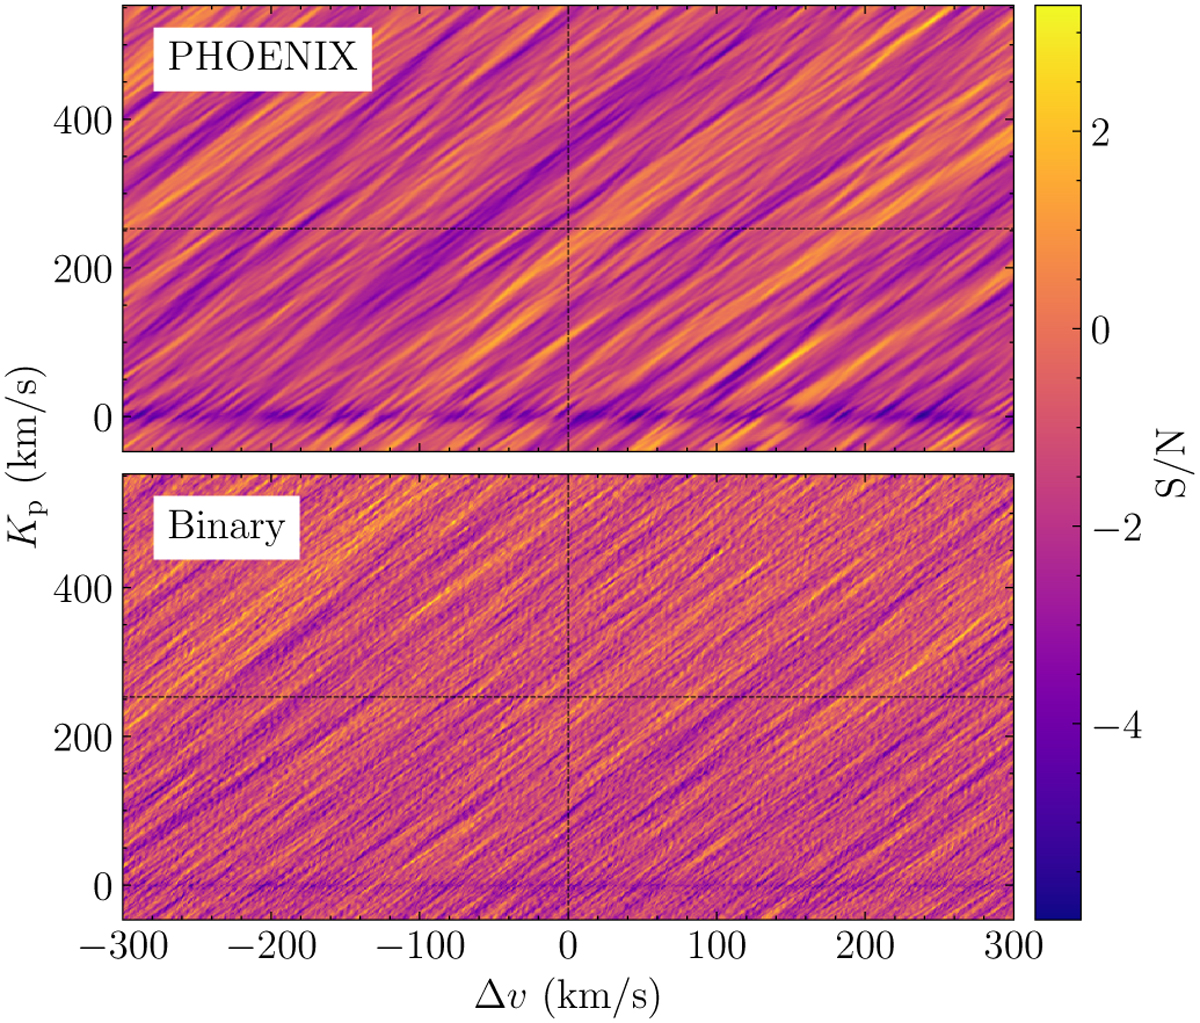
S/N map produced by cross-correlating the spectral residuals with the reflection templates as a function of the planetary radial velocity semi-amplitude, Kp, and the radial velocity deviation, Δv. The top and bottom maps present the results when using the PHOENIX-based and binary reflection template, respectively. The dashed black lines indicate where a genuine reflection signal would be expected to manifest.
Current usage metrics show cumulative count of Article Views (full-text article views including HTML views, PDF and ePub downloads, according to the available data) and Abstracts Views on Vision4Press platform.
Data correspond to usage on the plateform after 2015. The current usage metrics is available 48-96 hours after online publication and is updated daily on week days.
Initial download of the metrics may take a while.