Fig. B.1
Download original image
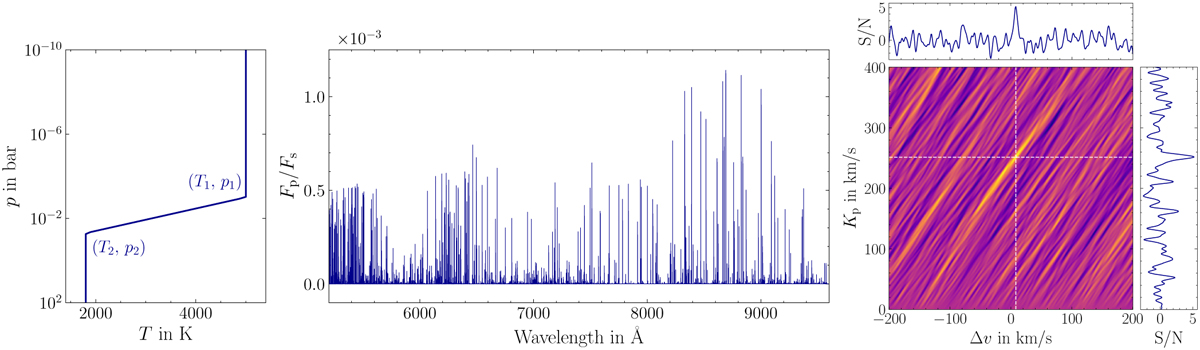
Left: Normalised FeI emission spectrum emerging from the dayside atmosphere of KELT-9 b as modelled with petitRADTRANS. Middle: Adopted T-p profile used for generating the emission template spectrum. Right: S/N map of FeI thermal emission from KELT-9 b’s dayside atmosphere. The signal peaks with a S/N of 5.2 after three consecutive SYSREM iterations. We indicate the coordinates of the strongest signal with the dashed white lines. Cross-sections of the S/N peak are shown in the horizontal and vertical panels.
Current usage metrics show cumulative count of Article Views (full-text article views including HTML views, PDF and ePub downloads, according to the available data) and Abstracts Views on Vision4Press platform.
Data correspond to usage on the plateform after 2015. The current usage metrics is available 48-96 hours after online publication and is updated daily on week days.
Initial download of the metrics may take a while.