Fig. 2.
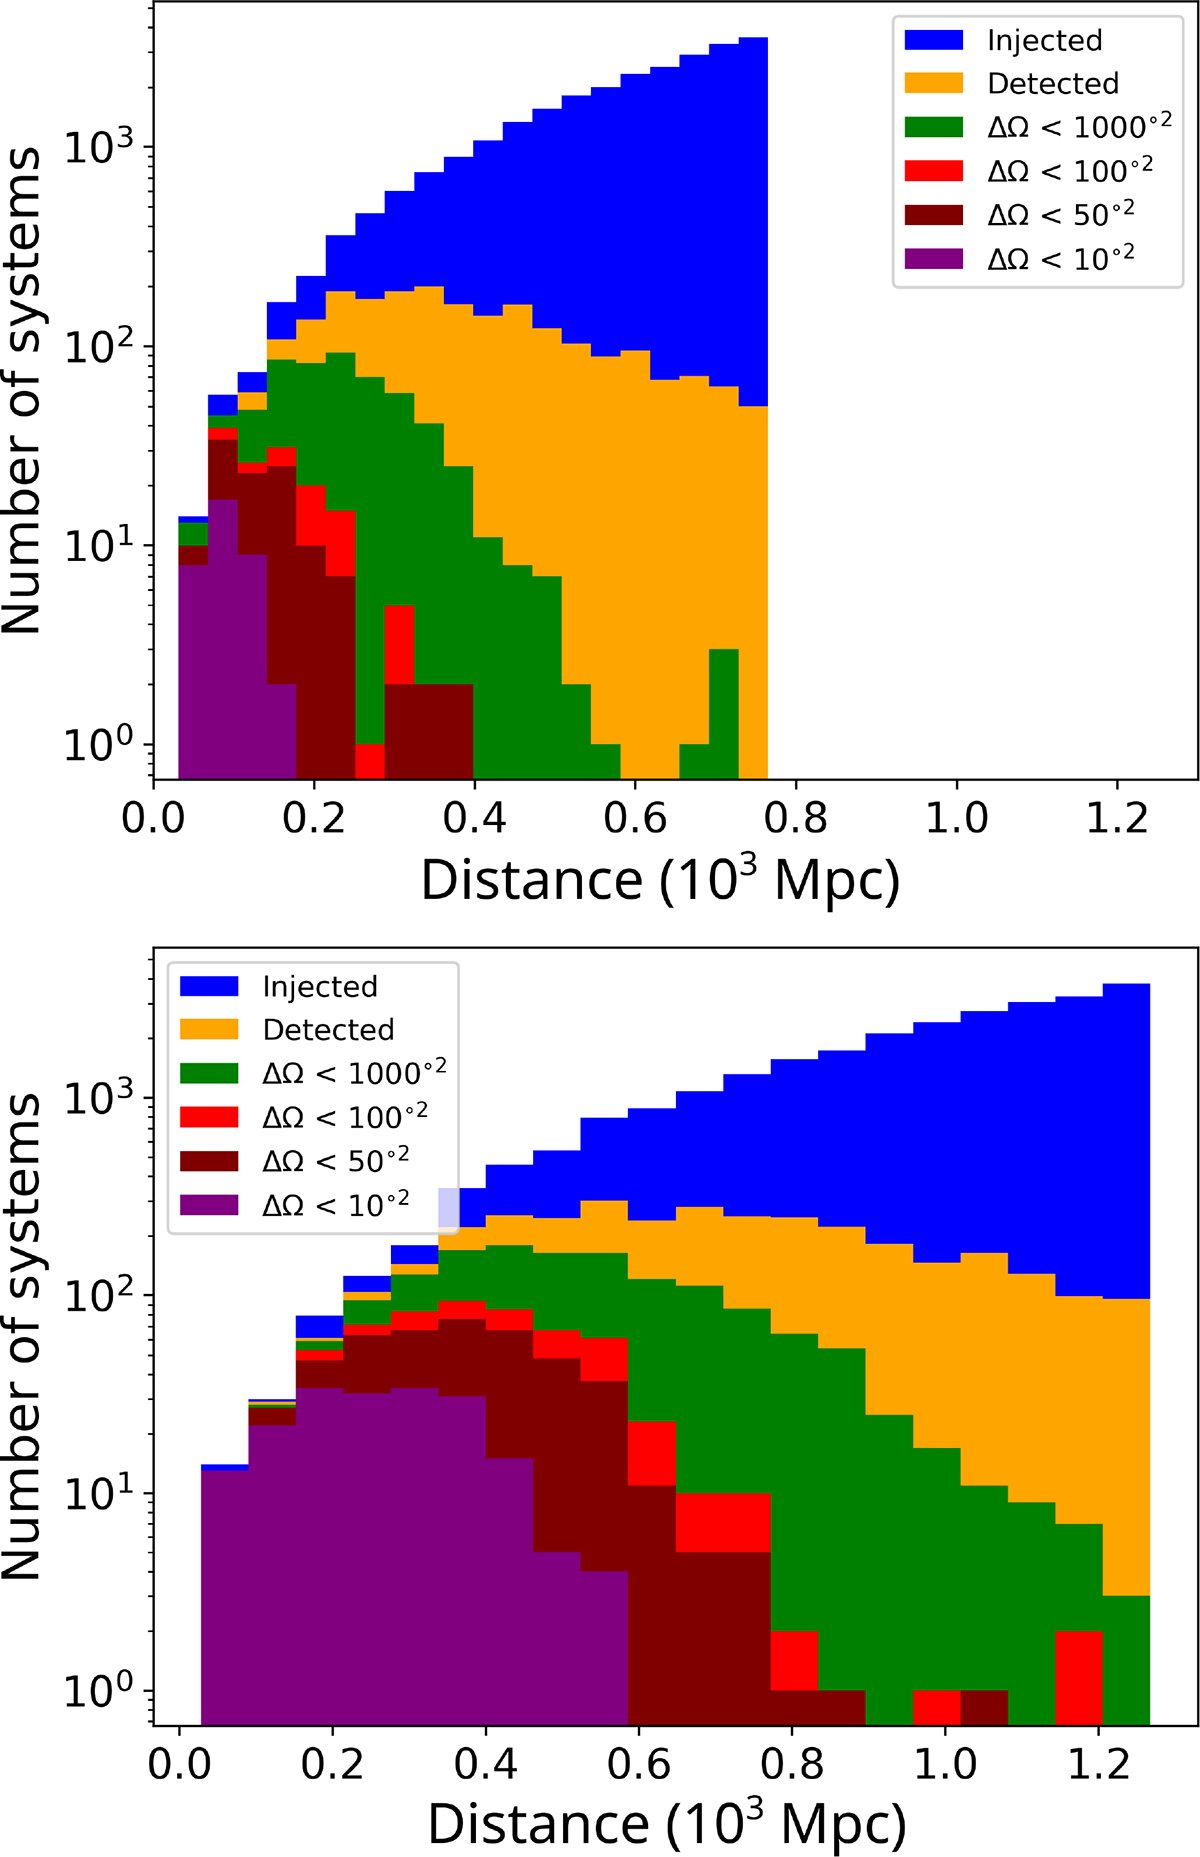
Download original image
Distribution of the GW localization accuracy obtained on the O4 (panel a) and O5 (panel b) GW run simulations. All the BNS of the synthetic population that went through the GW detection pipeline are shown in blue, all detected systems are shown in orange, and the localized systems are shown with colors dependent on their localization accuracy (noted here ΔΩ).
Current usage metrics show cumulative count of Article Views (full-text article views including HTML views, PDF and ePub downloads, according to the available data) and Abstracts Views on Vision4Press platform.
Data correspond to usage on the plateform after 2015. The current usage metrics is available 48-96 hours after online publication and is updated daily on week days.
Initial download of the metrics may take a while.