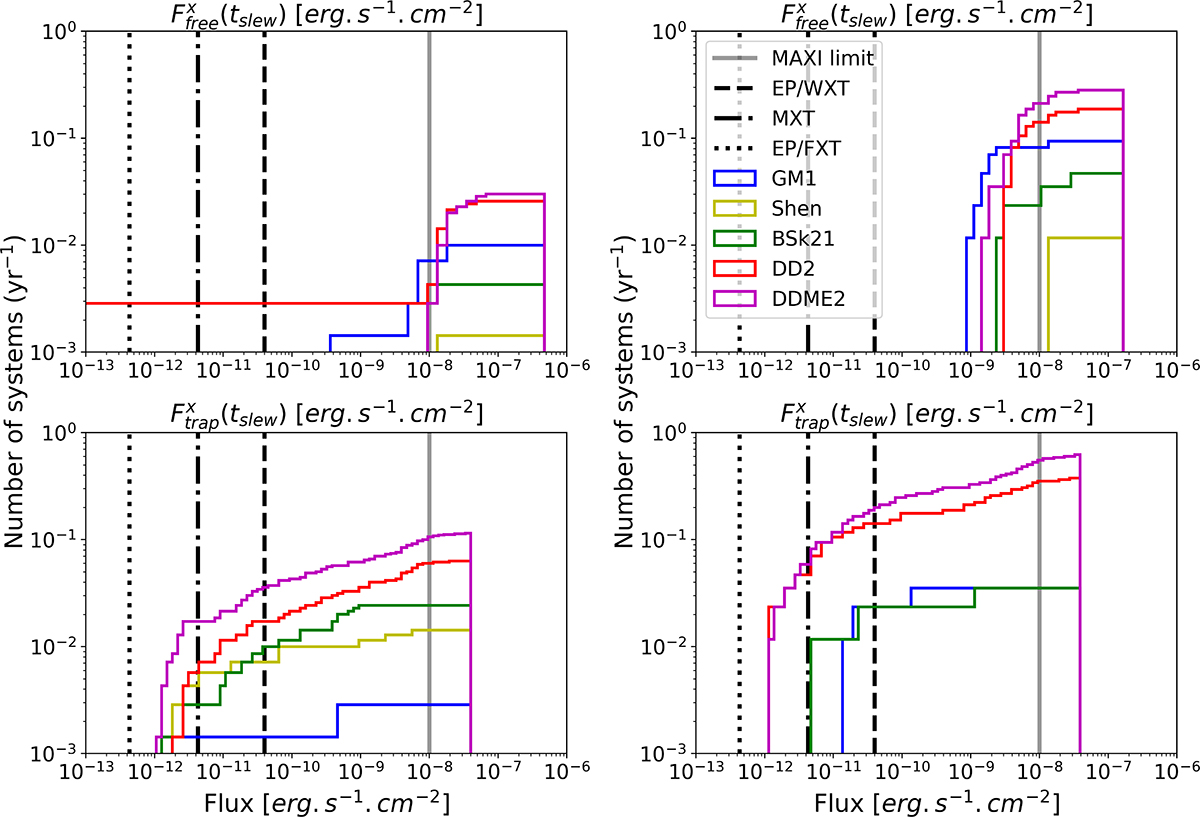
Fig. 6.
Download original image
Cumulative histograms showing the repartition of X-ray flux in the MXT band 1 h after the merger for GW well-localized events. The curves in different colors correspond to the five different EoS we considered. The vertical black lines indicate X-ray instruments sensitivity threshold for SVOM/MXT (dash-dotted), EP/WXT (dashed) and EP/FXT (dotted). The left and right panels correspond to O4 and O5 LVK(I) runs, respectively. The top and bottom panels correspond to the flux in the free and trapped zone, respectively. The shaded line represents the MAXI nondetection limit: fluxes above this limit and with an occurrence rate of ∼10−1 yr−1 or above are likely over-estimated.
Current usage metrics show cumulative count of Article Views (full-text article views including HTML views, PDF and ePub downloads, according to the available data) and Abstracts Views on Vision4Press platform.
Data correspond to usage on the plateform after 2015. The current usage metrics is available 48-96 hours after online publication and is updated daily on week days.
Initial download of the metrics may take a while.